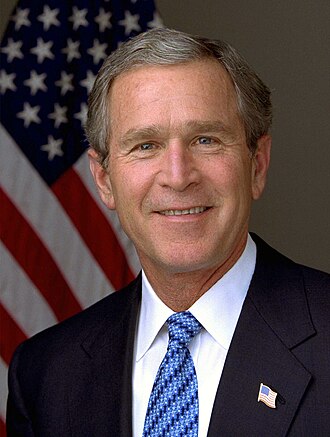
George W. Bush
43rd president · Republican · January 20, 2001 – January 19, 2009
George Walker Bush is an American former politician, businessman, and U.S. Air Force veteran who served as the 43rd president of the United States from 2001 to 2009. A member of the Republican Party, he served as the 46th governor of Texas from 1995 to 2000. (Wikipedia, CC BY-SA 4.0)
How to read this
Each card takes a series from one of the site’s Presidency, Congress or Supreme Court pages and shows only the time Bush was in office. Monthly figures run from the month of the inauguration to the month the term ended; a fiscal or calendar year counts for the president who held office for most of its days. Cards whose data begins after 2001 say where it starts, and a card with no data for the term is left out.
These are conditions during a presidency, not a scorecard. Congress, the courts, the Federal Reserve, the business cycle and events abroad move every one of these numbers, and many policies take effect years after they are signed, so a change during a term is not a measure of what the president caused.
Who held power
Party control of Congress
Republicans held both chambers for 4.5 years, one chamber for 1.5 years and neither for 2 years.
- 111th Congress2009House: Dem.257 D · 178 RSenate: Dem.59 D · 41 R
- 110th Congress2007–2009House: Dem.233 D · 202 RSenate: Dem.51 D · 49 R
- 109th Congress2005–2007House: Rep.202 D · 232 R · 1 otherSenate: Rep.45 D · 55 R
- 108th Congress2003–2005House: Rep.205 D · 229 R · 1 otherSenate: Rep.49 D · 51 R
- 107th Congress2001–2003House: Rep.212 D · 221 R · 2 otherSenate*: Dem.50 D · 50 R
* The Senate majority changed hands during this Congress; the chip shows the party that held it longer while this president was in office.
Seats are at the start of each Congress. Democrats and Republicans include the independents who caucused with them.
Data notes
Supreme Court appointments
George W. Bush appointed 2 justices: Roberts (2005) and Alito (2005).
 Samuel Alito · Associate justiceNominated Nov 10, 2005 · confirmed 58–42
 John Roberts · Chief justiceNominated Sep 6, 2005 · confirmed 78–22
Data notes
A justice counts for the president who nominated them (a recess appointment from the day it began, if earlier). An associate justice later made chief by another president, like William Rehnquist, counts as an elevation for the second. Failed and withdrawn nominations are not listed. Dates and Senate votes from the Federal Judicial Center.
Laws and orders
Laws signed
Signed 1,814 laws, 50 of them major laws. Congress enacted 4 more over a veto.
Laws signed per year in office
By policy area
- Commemorations525 (29%)
- Land, water & farming324 (18%)
- Government, justice & rights238 (13%)
- Economy, taxes & trade232 (13%)
- Health, education & culture198 (11%)
- Defense & foreign affairs157 (9%)
- Transport, housing & emergencies93 (5%)
- Energy & environment47 (3%)
Data notes
Public laws whose enactment date falls in the term, from Congress.gov (93rd Congress, 1973, on; private laws left out), counted through 2026-10-15. A law enacted over a veto is not counted as signed; a bill that became law without a signature is. A bar is one year in office, from the inauguration to the day before its anniversary. Policy areas are the Congressional Research Service’s, grouped as on the Laws page.
View as table
| Period | Value |
|---|---|
| 2001–02 | 133 |
| 2002–03 | 247 |
| 2003–04 | 195 |
| 2004–05 | 301 |
| 2005–06 | 168 |
| 2006–07 | 314 |
| 2007–08 | 178 |
| 2008–09 | 278 |
Executive orders
Signed 291 executive orders; the most common topic was government operations (86).
Executive orders per year in office
By topic
- Government operations86 (30%)
- National security & defense52 (18%)
- Foreign policy48 (16%)
- Economy, labor & technology39 (13%)
- Health & education28 (10%)
- Energy & environment17 (6%)
- Immigration & justice11 (4%)
- Trade & tariffs7 (2%)
- Civil rights & civic life3 (1%)
Data notes
Executive orders signed in the term, from the Federal Register, whose electronic record begins in 1994. Each order has one primary topic, assigned as on the Executive orders page. Counts say how many orders were signed, not how much they did: one order can set up a program or rename an office. A bar is one year in office.
View as table
| Period | Value |
|---|---|
| 2001–02 | 56 |
| 2002–03 | 29 |
| 2003–04 | 42 |
| 2004–05 | 46 |
| 2005–06 | 25 |
| 2006–07 | 27 |
| 2007–08 | 32 |
| 2008–09 | 34 |
Major laws signed
50 of the laws Bush signed are counted as important enactments, newest first, with how each passed the House and Senate.
- Oct 8, 2008United States-India Nuclear Cooperation Approval and Nonproliferation Enhancement ActDefense & foreign affairsHouse298–117 (298 yea, 117 nay)Senate86–13 (86 yea, 13 nay)
- Oct 3, 2008Emergency Economic Stabilization Act of 2008Health, education & cultureAuthorizes the Secretary of the Treasury (Secretary) to establish the Troubled Asset Relief Program (TARP) to purchase troubled assets from any financial institution, in accordance with terms, conditions, policies, and procedures the Secretary develops.House263–171 (263 yea, 171 nay)Senate74–25 (74 yea, 25 nay)
- Jul 30, 2008Housing and Economic Recovery Act of 2008Energy & environmentHouse272–152 (272 yea, 152 nay)Senate72–13 (72 yea, 13 nay)
- Jul 10, 2008FISA Amendments Act of 2008Defense & foreign affairsAmends the Foreign Intelligence Surveillance Act of 1978 (FISA) to add a new title concerning additional procedures for acquiring the communications of certain persons outside the United States.House293–129 (293 yea, 129 nay)Senate69–28 (69 yea, 28 nay)
- Jun 30, 2008Supplemental Appropriations Act, 2008Economy, taxes & tradeMakes supplemental appropriations for FY2008 to the Department of Agriculture for the Foreign Agricultural Service for grants under the Agricultural Trade Development and Assistance Act of 1954 (P.L. 480) for emergency and nonemergency food assistance to foreign countries.House416–12 (416 yea, 12 nay)Senate92–6 (92 yea, 6 nay)
- Feb 13, 2008Economic Stimulus Act of 2008Economy, taxes & tradeAmends the Internal Revenue Code to grant tax rebates of the lesser of net income tax liability or $600 to individual taxpayers ($1,200 for married taxpayers filing joint returns).House380–34 (380 yea, 34 nay)Senate81–16 (81 yea, 16 nay)
- Dec 19, 2007Energy Independence and Security Act of 2007Energy & environmentAmends federal transportation law to instruct the Secretary of Transportation (Secretary in this title) to prescribe separate average fuel economy standards for passenger and for non-passenger automobiles for model years 2011-2030.House314–100 (314 yea, 100 nay)Senate86–8 (86 yea, 8 nay)
- Sep 27, 2007College Cost Reduction and Access ActHealth, education & cultureGrants to Students in Attendance at Institutions of Higher Education - (Sec. 101) Amends the Higher Education Act of 1965 (HEA) to repeal the formula for calculating an individual Pell grant which includes, in part, the sum of the student's tuition.House292–97 (292 yea, 97 nay)Senate79–12 (79 yea, 12 nay)
- Sep 14, 2007Honest Leadership and Open Government Act of 2007Government, justice & rightsHouse411–8 (411 yea, 8 nay)Senate83–14 (83 yea, 14 nay)
- Aug 3, 2007Implementing Recommendations of the 9/11 Commission Act of 2007Transport, housing & emergenciesProvides for implementation of recommendations of the National Commission on Terrorist Attacks Upon the United States (9/11 Commission).House371–40 (371 yea, 40 nay)Senate85–8 (85 yea, 8 nay)
- May 25, 2007U.S. Troop Readiness, Veterans' Care, Katrina Recovery, and Iraq Accountability Appropriations Act, 2007Economy, taxes & tradeMakes additional FY2007 appropriations to the Department of Agriculture, Foreign Agricultural Service, for commodities supplied in connection with dispositions abroad under Public Law 480 Title II Grants.House280–142 (280 yea, 142 nay)Senate80–14 (80 yea, 14 nay)
- Dec 20, 2006Postal Accountability and Enhancement ActGovernment, justice & rightsAmends federal law provisions concerning the Postal Service to add definitions, including the terms postal service, competitive product, market-dominant product, and rates.HouseVoice voteSenateUnanimous consent
- Dec 20, 2006Tax Relief and Health Care Act of 2006Economy, taxes & tradeHouse367–45 (367 yea, 45 nay)Senate79–9 (79 yea, 9 nay)
- Dec 18, 2006Henry J. Hyde United States and India Nuclear Cooperation Promotion Act of 2006Defense & foreign affairsHouse330–59 (330 yea, 59 nay)SenateUnanimous consent
- Oct 26, 2006Secure Fence Act of 2006Government, justice & rightsHouse283–138 (283 yea, 138 nay)Senate80–19 (80 yea, 19 nay)
- Oct 17, 2006Military Commissions Act of 2006Defense & foreign affairsHouse250–170 (250 yea, 170 nay)Senate65–34 (65 yea, 34 nay)
- Oct 13, 2006SAFE Port ActTransport, housing & emergenciesHouse409–2 (409 yea, 2 nay)SenateUnanimous consent
- Aug 17, 2006Pension Protection Act of 2006Economy, taxes & tradeHouse279–131 (279 yea, 131 nay)Senate93–5 (93 yea, 5 nay)
- Dec 30, 2005Department of Defense, Emergency Supplemental Appropriations to Address Hurricanes in the Gulf of Mexico, and Pandemic Influenza Act, 2006Defense & foreign affairsHouse308–106 (308 yea, 106 nay)Senate93–0 (93 yea, 0 nay)
- Aug 10, 2005SAFETEA-LUTransport, housing & emergenciesHouse412–8 (412 yea, 8 nay)Senate91–4 (91 yea, 4 nay)
- Aug 8, 2005Energy Policy Act of 2005Energy & environmentHouse275–156 (275 yea, 156 nay)Senate74–26 (74 yea, 26 nay)
- Aug 2, 2005Dominican Republic-Central America-United States Free Trade Agreement Implementation ActEconomy, taxes & tradeHouse217–215 (217 yea, 215 nay)Senate55–45 (55 yea, 45 nay)
- Apr 20, 2005Bankruptcy Abuse Prevention and Consumer Protection Act of 2005Economy, taxes & tradeAmends Federal bankruptcy law to revamp guidelines governing dismissal or conversion of a Chapter 7 liquidation (complete relief in bankruptcy) to one under either Chapter 11 (Reorganization) or Chapter 13 (Adjustment of Debts of an Individual with Regular Income).House302–126 (302 yea, 126 nay)Senate74–25 (74 yea, 25 nay)
- Feb 18, 2005Class Action Fairness Act of 2005Government, justice & rightsAmends the Federal judicial code to specify the calculation of contingent and other attorney's fees in proposed class action settlements that provide for the award of coupons to class members.House279–149 (279 yea, 149 nay)Senate72–26 (72 yea, 26 nay)
- Dec 17, 2004Intelligence Reform and Terrorism Prevention Act of 2004Defense & foreign affairsAmends the National Security Act of 1947 to establish a Director of National Intelligence (Director), to be appointed by the President with the advice and consent of the Senate.House336–75 (336 yea, 75 nay)Senate89–2 (89 yea, 2 nay)
- Oct 22, 2004American Jobs Creation Act of 2004Economy, taxes & tradeAmends the Internal Revenue Code to repeal the tax exclusion for extraterritorial income.House280–141 (280 yea, 141 nay)Senate69–17 (69 yea, 17 nay)
- Oct 13, 2004Military Construction Appropriations and Emergency Hurricane Supplemental Appropriations Act, 2005Defense & foreign affairsHouse374–0 (374 yea, 0 nay)SenateVoice vote
- Apr 1, 2004Unborn Victims of Violence Act of 2004Government, justice & rightsHouse254–163 (254 yea, 163 nay)Senate61–38 (61 yea, 38 nay)
- Dec 8, 2003Medicare Prescription Drug, Improvement, and Modernization Act of 2003Health, education & cultureMedicare Prescription Drug Benefit (Sec. 101) Amends title XVIII (Medicare) of the Social Security Act (SSA) to add a new part D (Voluntary Prescription Drug Benefit Program).House220–215 (220 yea, 215 nay)Senate54–44 (54 yea, 44 nay)
- Dec 3, 2003Healthy Forests Restoration Act of 2003Land, water & farmingHouse286–140 (286 yea, 140 nay)SenateUnanimous consent
- Nov 6, 2003Emergency Supplemental Appropriations Act for Defense and for the Reconstruction of Iraq and Afghanistan, 2004Economy, taxes & tradeMakes emergency supplemental appropriations for FY 2004 for military and foreign affairs operations concerning Iraq and Afghanistan, including for Iraqi relief and reconstruction.House298–121 (298 yea, 121 nay)SenateVoice vote
- Nov 5, 2003Partial-Birth Abortion Ban Act of 2003Government, justice & rightsAmends the Federal criminal code to prohibit any physician or other individual from knowingly performing a partial-birth abortion, except when necessary to save the life of a mother whose life is endangered by a physical disorder, illness, or injury.House281–142 (281 yea, 142 nay)Senate64–34 (64 yea, 34 nay)
- May 28, 2003Jobs and Growth Tax Relief Reconciliation Act of 2003Economy, taxes & tradeAmends the Internal Revenue Code to accelerate the increase to the $1,000 child tax credit to include 2003 and 2004.House231–200 (231 yea, 200 nay)Senate51–50 (51 yea, 50 nay)
- May 27, 2003United States Leadership Against HIV/AIDS, Tuberculosis, and Malaria Act of 2003Defense & foreign affairsRequires the President to establish a comprehensive, integrated, five-year strategy to combat the global spread of HIV and AIDS.HouseVoice voteSenateVoice vote
- Nov 27, 2002Intelligence Authorization Act for Fiscal Year 2003Defense & foreign affairsHouse366–3 (366 yea, 3 nay)SenateUnanimous consent
- Nov 26, 2002Terrorism Risk Insurance Act of 2002Economy, taxes & tradeEstablishes a three-year Terrorism Insurance Program in the Department of the Treasury, administered by the Secretary of the Treasury, to pay the Federal share of compensation for insured losses resulting from acts of terrorism.HouseVoice voteSenate86–11 (86 yea, 11 nay)
- Nov 25, 2002Homeland Security Act of 2002Government, justice & rightsHouseUnanimous consentSenate90–9 (90 yea, 9 nay)
- Oct 29, 2002Help America Vote Act of 2002Government, justice & rightsDirects the Administrator of General Services to establish a program for payment to each State that intends to use the payment in accordance with specified guidelines for activities to improve the administration of elections for Federal office.House357–48 (357 yea, 48 nay)Senate92–2 (92 yea, 2 nay)
- Oct 16, 2002Authorization for Use of Military Force Against Iraq Resolution of 2002Defense & foreign affairsHouse296–133 (296 yea, 133 nay)Senate77–23 (77 yea, 23 nay)
- Aug 6, 2002Trade Act of 2002Economy, taxes & tradeAmends the Trade Act of 1974 to reauthorize the trade adjustment assistance (TAA) program through FY 2007 for workers and firms adversely affected by import competition.House215–212 (215 yea, 212 nay)Senate64–34 (64 yea, 34 nay)
- Jul 30, 2002Sarbanes-Oxley Act of 2002Economy, taxes & tradeHouse423–3 (423 yea, 3 nay)Senate99–0 (99 yea, 0 nay)
- May 13, 2002Farm Security and Rural Investment Act of 2002Land, water & farmingHouse280–141 (280 yea, 141 nay)Senate64–35 (64 yea, 35 nay)
- Mar 27, 2002Bipartisan Campaign Reform Act of 2002Government, justice & rightsHouse240–189 (240 yea, 189 nay)Senate60–40 (60 yea, 40 nay)
- Jan 8, 2002No Child Left Behind Act of 2001 Health, education & cultureAmends the Elementary and Secondary Education Act of 1965 (ESEA) to revise, reauthorize, and consolidate various programs.House381–41 (381 yea, 41 nay)Senate87–10 (87 yea, 10 nay)
- Nov 19, 2001Aviation and Transportation Security ActTransport, housing & emergenciesHouse410–9 (410 yea, 9 nay)SenateVoice vote
- Oct 26, 2001USA PATRIOT ActGovernment, justice & rightsUniting and Strengthening America by Providing Appropriate Tools Required to Intercept and Obstruct Terrorism (USA PATRIOT ACT) Act of 2001 - Title I: Enhancing Domestic Security Against Terrorism - Establishes in the Treasury the Counterterrorism Fund.House357–66 (357 yea, 66 nay)Senate98–1 (98 yea, 1 nay)
- Sep 22, 2001Air Transportation Safety and System Stabilization ActTransport, housing & emergenciesHouseUnanimous consentSenateUnanimous consent
- Sep 18, 2001Authorization for Use of Military ForceDefense & foreign affairsHouseUnanimous consentSenate98–0 (98 yea, 0 nay)
- Sep 18, 20012001 Emergency Supplemental Appropriations Act for Recovery from and Response to Terrorist Attacks on the United StatesEconomy, taxes & tradeMakes emergency supplemental appropriations for FY 2001 for emergency expenses to respond to the terrorist attacks on the United States on September 11, 2001, to provide assistance to the victims, and to deal with other consequences of the attacks.House422–0 (422 yea, 0 nay)SenateUnanimous consent
- Jun 7, 2001Economic Growth and Tax Relief Reconciliation Act of 2001Economy, taxes & tradeHouse240–154 (240 yea, 154 nay)Senate58–33 (58 yea, 33 nay)
Data notes
Laws counted as important enactments, the same list the Laws page uses for its “Major law” badge, which explains where it comes from. The list does not yet cover a Congress still in session. Each summary is the first sentence of the Congressional Research Service summary, where one stands alone; votes are each chamber’s final-passage tally, or how it passed without a recorded vote.
Economy
Misery index
The misery index (unemployment plus inflation) was 7.9 in January 2001 and 7.7 in January 2009, with a high of 11.4 in August 2008.
Misery index
Unemployment and inflation
Data notes
The misery index adds the unemployment rate to inflation (consumer prices, change from a year earlier) for the same month. Unemployment is the BLS rate, seasonally adjusted, from 1948; inflation is from the consumer price index, from 1948. The first reading is the month the president took office, the last the month the term ended. Both are national averages and are revised.
View as table
| Period | Value |
|---|---|
| Jan 2001 | 7.9 |
| Feb 2001 | 7.7 |
| Mar 2001 | 7.3 |
| Apr 2001 | 7.6 |
| May 2001 | 7.9 |
| Jun 2001 | 7.7 |
| Jul 2001 | 7.3 |
| Aug 2001 | 7.6 |
| Sep 2001 | 7.6 |
| Oct 2001 | 7.4 |
| Nov 2001 | 7.4 |
| Dec 2001 | 7.3 |
| Jan 2002 | 6.9 |
| Feb 2002 | 6.8 |
| Mar 2002 | 7.1 |
| Apr 2002 | 7.5 |
| May 2002 | 7 |
| Jun 2002 | 6.9 |
| Jul 2002 | 7.3 |
| Aug 2002 | 7.4 |
| Sep 2002 | 7.2 |
| Oct 2002 | 7.7 |
| Nov 2002 | 8.2 |
| Dec 2002 | 8.5 |
| Jan 2003 | 8.6 |
| Feb 2003 | 9 |
| Mar 2003 | 8.9 |
| Apr 2003 | 8.2 |
| May 2003 | 8 |
| Jun 2003 | 8.2 |
| Jul 2003 | 8.3 |
| Aug 2003 | 8.3 |
| Sep 2003 | 8.5 |
| Oct 2003 | 8 |
| Nov 2003 | 7.7 |
| Dec 2003 | 7.7 |
| Jan 2004 | 7.7 |
| Feb 2004 | 7.3 |
| Mar 2004 | 7.5 |
| Apr 2004 | 7.9 |
| May 2004 | 8.5 |
| Jun 2004 | 8.8 |
| Jul 2004 | 8.4 |
| Aug 2004 | 7.9 |
| Sep 2004 | 7.9 |
| Oct 2004 | 8.7 |
| Nov 2004 | 9 |
| Dec 2004 | 8.7 |
| Jan 2005 | 8.1 |
| Feb 2005 | 8.5 |
| Mar 2005 | 8.4 |
| Apr 2005 | 8.6 |
| May 2005 | 8 |
| Jun 2005 | 7.5 |
| Jul 2005 | 8.1 |
| Aug 2005 | 8.5 |
| Sep 2005 | 9.7 |
| Oct 2005 | 9.4 |
| Nov 2005 | 8.3 |
| Dec 2005 | 8.2 |
| Jan 2006 | 8.7 |
| Feb 2006 | 8.4 |
| Mar 2006 | 8.1 |
| Apr 2006 | 8.3 |
| May 2006 | 8.6 |
| Jun 2006 | 8.8 |
| Jul 2006 | 8.8 |
| Aug 2006 | 8.6 |
| Sep 2006 | 6.5 |
| Oct 2006 | 5.8 |
| Nov 2006 | 6.5 |
| Dec 2006 | 6.9 |
| Jan 2007 | 6.7 |
| Feb 2007 | 6.9 |
| Mar 2007 | 7.2 |
| Apr 2007 | 7.1 |
| May 2007 | 7.1 |
| Jun 2007 | 7.3 |
| Jul 2007 | 7 |
| Aug 2007 | 6.5 |
| Sep 2007 | 7.5 |
| Oct 2007 | 8.3 |
| Nov 2007 | 9.1 |
| Dec 2007 | 9.1 |
| Jan 2008 | 9.3 |
| Feb 2008 | 9 |
| Mar 2008 | 9.1 |
| Apr 2008 | 8.9 |
| May 2008 | 9.5 |
| Jun 2008 | 10.5 |
| Jul 2008 | 11.3 |
| Aug 2008 | 11.4 |
| Sep 2008 | 11.1 |
| Oct 2008 | 10.2 |
| Nov 2008 | 7.9 |
| Dec 2008 | 7.3 |
| Jan 2009 | 7.7 |
| Period | Unemployment rate | Inflation |
|---|---|---|
| Jan 2001 | 4.2% | 3.7% |
| Feb 2001 | 4.2% | 3.5% |
| Mar 2001 | 4.3% | 3% |
| Apr 2001 | 4.4% | 3.2% |
| May 2001 | 4.3% | 3.6% |
| Jun 2001 | 4.5% | 3.2% |
| Jul 2001 | 4.6% | 2.7% |
| Aug 2001 | 4.9% | 2.7% |
| Sep 2001 | 5% | 2.6% |
| Oct 2001 | 5.3% | 2.1% |
| Nov 2001 | 5.5% | 1.9% |
| Dec 2001 | 5.7% | 1.6% |
| Jan 2002 | 5.7% | 1.2% |
| Feb 2002 | 5.7% | 1.1% |
| Mar 2002 | 5.7% | 1.4% |
| Apr 2002 | 5.9% | 1.6% |
| May 2002 | 5.8% | 1.2% |
| Jun 2002 | 5.8% | 1.1% |
| Jul 2002 | 5.8% | 1.5% |
| Aug 2002 | 5.7% | 1.7% |
| Sep 2002 | 5.7% | 1.5% |
| Oct 2002 | 5.7% | 2% |
| Nov 2002 | 5.9% | 2.3% |
| Dec 2002 | 6% | 2.5% |
| Jan 2003 | 5.8% | 2.8% |
| Feb 2003 | 5.9% | 3.1% |
| Mar 2003 | 5.9% | 3% |
| Apr 2003 | 6% | 2.2% |
| May 2003 | 6.1% | 1.9% |
| Jun 2003 | 6.3% | 1.9% |
| Jul 2003 | 6.2% | 2.1% |
| Aug 2003 | 6.1% | 2.2% |
| Sep 2003 | 6.1% | 2.4% |
| Oct 2003 | 6% | 2% |
| Nov 2003 | 5.8% | 1.9% |
| Dec 2003 | 5.7% | 2% |
| Jan 2004 | 5.7% | 2% |
| Feb 2004 | 5.6% | 1.7% |
| Mar 2004 | 5.8% | 1.7% |
| Apr 2004 | 5.6% | 2.3% |
| May 2004 | 5.6% | 2.9% |
| Jun 2004 | 5.6% | 3.2% |
| Jul 2004 | 5.5% | 2.9% |
| Aug 2004 | 5.4% | 2.5% |
| Sep 2004 | 5.4% | 2.5% |
| Oct 2004 | 5.5% | 3.2% |
| Nov 2004 | 5.4% | 3.6% |
| Dec 2004 | 5.4% | 3.3% |
| Jan 2005 | 5.3% | 2.8% |
| Feb 2005 | 5.4% | 3.1% |
| Mar 2005 | 5.2% | 3.2% |
| Apr 2005 | 5.2% | 3.4% |
| May 2005 | 5.1% | 2.9% |
| Jun 2005 | 5% | 2.5% |
| Jul 2005 | 5% | 3.1% |
| Aug 2005 | 4.9% | 3.6% |
| Sep 2005 | 5% | 4.7% |
| Oct 2005 | 5% | 4.4% |
| Nov 2005 | 5% | 3.3% |
| Dec 2005 | 4.9% | 3.3% |
| Jan 2006 | 4.7% | 4% |
| Feb 2006 | 4.8% | 3.6% |
| Mar 2006 | 4.7% | 3.4% |
| Apr 2006 | 4.7% | 3.6% |
| May 2006 | 4.6% | 4% |
| Jun 2006 | 4.6% | 4.2% |
| Jul 2006 | 4.7% | 4.1% |
| Aug 2006 | 4.7% | 3.9% |
| Sep 2006 | 4.5% | 2% |
| Oct 2006 | 4.4% | 1.4% |
| Nov 2006 | 4.5% | 2% |
| Dec 2006 | 4.4% | 2.5% |
| Jan 2007 | 4.6% | 2.1% |
| Feb 2007 | 4.5% | 2.4% |
| Mar 2007 | 4.4% | 2.8% |
| Apr 2007 | 4.5% | 2.6% |
| May 2007 | 4.4% | 2.7% |
| Jun 2007 | 4.6% | 2.7% |
| Jul 2007 | 4.7% | 2.3% |
| Aug 2007 | 4.6% | 1.9% |
| Sep 2007 | 4.7% | 2.8% |
| Oct 2007 | 4.7% | 3.6% |
| Nov 2007 | 4.7% | 4.4% |
| Dec 2007 | 5% | 4.1% |
| Jan 2008 | 5% | 4.3% |
| Feb 2008 | 4.9% | 4.1% |
| Mar 2008 | 5.1% | 4% |
| Apr 2008 | 5% | 3.9% |
| May 2008 | 5.4% | 4.1% |
| Jun 2008 | 5.6% | 4.9% |
| Jul 2008 | 5.8% | 5.5% |
| Aug 2008 | 6.1% | 5.3% |
| Sep 2008 | 6.1% | 5% |
| Oct 2008 | 6.5% | 3.7% |
| Nov 2008 | 6.8% | 1.1% |
| Dec 2008 | 7.3% | −0% |
| Jan 2009 | 7.8% | −0.1% |
Federal deficit and debt
The federal budget balance, as a share of GDP, was +1.2% in FY2001 and −3.1% in FY2008, with a low of −3.4% in FY2004.
Budget balance, % of GDP
Public debt, % of GDP
Data notes
The budget balance is the federal surplus (above zero) or deficit (below) as a share of GDP, by fiscal year (July to June through 1976, October to September since); a year counts for the president in office for most of it, though its budget was usually passed the year before. Debt is total public debt as a share of GDP, quarterly from 1966, including debt the government holds in its own trust funds.
View as table
| Period | Value |
|---|---|
| FY2001 | +1.2% |
| FY2002 | −1.4% |
| FY2003 | −3.3% |
| FY2004 | −3.4% |
| FY2005 | −2.4% |
| FY2006 | −1.8% |
| FY2007 | −1.1% |
| FY2008 | −3.1% |
| Period | Value |
|---|---|
| Q1 2001 | 55.1% |
| Q2 2001 | 54% |
| Q3 2001 | 54.8% |
| Q4 2001 | 55.8% |
| Q1 2002 | 55.7% |
| Q2 2002 | 56.3% |
| Q3 2002 | 56.7% |
| Q4 2002 | 57.9% |
| Q1 2003 | 57.8% |
| Q2 2003 | 59% |
| Q3 2003 | 58.6% |
| Q4 2003 | 59.4% |
| Q1 2004 | 59.8% |
| Q2 2004 | 60.1% |
| Q3 2004 | 60% |
| Q4 2004 | 60.6% |
| Q1 2005 | 60.9% |
| Q2 2005 | 60.6% |
| Q3 2005 | 60.4% |
| Q4 2005 | 61.3% |
| Q1 2006 | 61.6% |
| Q2 2006 | 61.2% |
| Q3 2006 | 61.3% |
| Q4 2006 | 61.8% |
| Q1 2007 | 62.3% |
| Q2 2007 | 61.6% |
| Q3 2007 | 61.8% |
| Q4 2007 | 62.7% |
| Q1 2008 | 64.2% |
| Q2 2008 | 63.9% |
| Q3 2008 | 67.3% |
| Q4 2008 | 73.2% |
| Q1 2009 | 77.1% |
Immigration
Green cards and refugees
New green cards numbered 1.06M in FY2001 and 1.11M in FY2008, with a high of 1.27M in FY2006.
Green cards
Refugee admissions
Data notes
Green cards are people who became lawful permanent residents in the fiscal year, from the DHS Yearbook of Immigration Statistics (from FY1977). Refugee admissions are from the State Department’s Refugee Processing Center (from FY1980). A fiscal year counts for the administration in office for most of its days; a hatched bar is preliminary.
View as table
| Period | Value |
|---|---|
| FY2001 | 1,058,902 |
| FY2002 | 1,059,356 |
| FY2003 | 703,542 |
| FY2004 | 957,883 |
| FY2005 | 1,122,257 |
| FY2006 | 1,266,129 |
| FY2007 | 1,052,415 |
| FY2008 | 1,107,126 |
| Period | Value |
|---|---|
| FY2001 | 69,886 |
| FY2002 | 27,131 |
| FY2003 | 28,403 |
| FY2004 | 52,873 |
| FY2005 | 53,813 |
| FY2006 | 41,223 |
| FY2007 | 48,282 |
| FY2008 | 60,191 |
Removals and border encounters
Removals numbered 189k in FY2001 and 369k in FY2008, with a low of 157k in FY2003.
Removals
Border encounters
Data notes
Removals are formal deportations: the Immigration and Naturalization Service’s through FY2002 (DHS Yearbook) and ICE’s own count from FY2003 (ICE); the two are not the same measure. Border encounters are Border Patrol apprehensions, plus port-of-entry inadmissibles from FY2004 and Title 42 expulsions in FY2020–23 (CBP); they count events, not people. A hatched bar is preliminary.
View as table
| Period | Value |
|---|---|
| FY2001 | 189,030 |
| FY2002 | 165,170 |
| FY2003 | 157,080 |
| FY2004 | 175,106 |
| FY2005 | 180,189 |
| FY2006 | 207,776 |
| FY2007 | 291,060 |
| FY2008 | 369,221 |
| Period | Value |
|---|---|
| FY2001 | 1,266,214 |
| FY2002 | 955,310 |
| FY2003 | 931,557 |
| FY2004 | 1,330,905 |
| FY2005 | 1,440,275 |
| FY2006 | 1,296,722 |
| FY2007 | 1,078,734 |
| FY2008 | 946,625 |
The U.S. and the world
Goods trade balance
The monthly goods trade balance was −$39.6B in January 2001 and −$46.7B in January 2009, with a high of −$30.5B in December 2001.
Goods balance, $B a month
Data notes
The goods trade balance is exports minus imports of goods, in billions of dollars a month, seasonally adjusted, on the Census basis, from 1991 (Census Bureau). Below zero the U.S. imported more goods than it exported. Services are not included. Dollars are not adjusted for inflation, so later years run larger.
View as table
| Period | Value |
|---|---|
| Jan 2001 | −$39.6B |
| Feb 2001 | −$34.2B |
| Mar 2001 | −$37.5B |
| Apr 2001 | −$35.4B |
| May 2001 | −$31.4B |
| Jun 2001 | −$33.9B |
| Jul 2001 | −$34.4B |
| Aug 2001 | −$32.9B |
| Sep 2001 | −$34.6B |
| Oct 2001 | −$34.3B |
| Nov 2001 | −$33.3B |
| Dec 2001 | −$30.5B |
| Jan 2002 | −$33.5B |
| Feb 2002 | −$35.8B |
| Mar 2002 | −$35.5B |
| Apr 2002 | −$38B |
| May 2002 | −$38.2B |
| Jun 2002 | −$39.1B |
| Jul 2002 | −$38.1B |
| Aug 2002 | −$40.5B |
| Sep 2002 | −$40.7B |
| Oct 2002 | −$38.8B |
| Nov 2002 | −$43.3B |
| Dec 2002 | −$46.7B |
| Jan 2003 | −$44.2B |
| Feb 2003 | −$42.9B |
| Mar 2003 | −$46.3B |
| Apr 2003 | −$44.6B |
| May 2003 | −$44.3B |
| Jun 2003 | −$42.8B |
| Jul 2003 | −$44.4B |
| Aug 2003 | −$42.8B |
| Sep 2003 | −$44.7B |
| Oct 2003 | −$44.8B |
| Nov 2003 | −$43.1B |
| Dec 2003 | −$47.5B |
| Jan 2004 | −$48.2B |
| Feb 2004 | −$48.1B |
| Mar 2004 | −$50.8B |
| Apr 2004 | −$51.5B |
| May 2004 | −$52B |
| Jun 2004 | −$58B |
| Jul 2004 | −$55.3B |
| Aug 2004 | −$56.1B |
| Sep 2004 | −$54.8B |
| Oct 2004 | −$58.6B |
| Nov 2004 | −$62.6B |
| Dec 2004 | −$58.8B |
| Jan 2005 | −$60.4B |
| Feb 2005 | −$62.7B |
| Mar 2005 | −$58.1B |
| Apr 2005 | −$61.6B |
| May 2005 | −$60.6B |
| Jun 2005 | −$62.7B |
| Jul 2005 | −$62.7B |
| Aug 2005 | −$63B |
| Sep 2005 | −$69.7B |
| Oct 2005 | −$72.4B |
| Nov 2005 | −$68.9B |
| Dec 2005 | −$69.5B |
| Jan 2006 | −$72.4B |
| Feb 2006 | −$67.1B |
| Mar 2006 | −$67.5B |
| Apr 2006 | −$68.1B |
| May 2006 | −$70.4B |
| Jun 2006 | −$68.8B |
| Jul 2006 | −$71.9B |
| Aug 2006 | −$73.1B |
| Sep 2006 | −$70.4B |
| Oct 2006 | −$65.1B |
| Nov 2006 | −$64.8B |
| Dec 2006 | −$68.3B |
| Jan 2007 | −$65.2B |
| Feb 2007 | −$66.2B |
| Mar 2007 | −$68.9B |
| Apr 2007 | −$67.1B |
| May 2007 | −$66.7B |
| Jun 2007 | −$67.8B |
| Jul 2007 | −$67.9B |
| Aug 2007 | −$65.9B |
| Sep 2007 | −$66.8B |
| Oct 2007 | −$67.4B |
| Nov 2007 | −$70.8B |
| Dec 2007 | −$68.1B |
| Jan 2008 | −$71B |
| Feb 2008 | −$72B |
| Mar 2008 | −$69.2B |
| Apr 2008 | −$72.4B |
| May 2008 | −$72.9B |
| Jun 2008 | −$71.2B |
| Jul 2008 | −$76B |
| Aug 2008 | −$70B |
| Sep 2008 | −$68.7B |
| Oct 2008 | −$69.1B |
| Nov 2008 | −$52.6B |
| Dec 2008 | −$51.2B |
| Jan 2009 | −$46.7B |
Foreign aid
Foreign aid disbursed came to $15B in FY2001 and $42.2B in FY2008. Iraq received the most in 4 of those years.
Disbursed, $ billions
Data notes
U.S. foreign assistance disbursed in each fiscal year, every country plus regional and global programs, in billions of dollars not adjusted for inflation, from ForeignAssistance.gov (from FY2001). The newest year is incomplete until agencies finish reporting and is hatched. The top recipient counts countries only.
View as table
| Period | Value |
|---|---|
| FY2001 | $15B |
| FY2002 | $18.6B |
| FY2003 | $23.7B |
| FY2004 | $26.1B |
| FY2005 | $32.8B |
| FY2006 | $32.6B |
| FY2007 | $34.8B |
| FY2008 | $42.2B |
Security and energy
Troops abroad
Troops stationed abroad numbered 255k in September 2001 and 364k in September 2008, with a high of 503k in September 2005. Iraq hosted the most in 6 of those years.
Active-duty troops abroad
Data notes
Active-duty U.S. military personnel stationed outside the United States and its territories (afloat and unassigned included where the source reports them), one snapshot a year (September; June for 1953–56), from the Defense Manpower Data Center’s tables and, for years it did not publish, troopdata. The year in progress shows its latest quarter, hatched. From December 2017 DMDC counts permanent assignments only, so later figures leave out most deployed forces.
View as table
| Period | Value |
|---|---|
| Sep 2001 | 254,846 |
| Sep 2002 | 230,529 |
| Sep 2003 | 435,805 |
| Sep 2004 | 458,475 |
| Sep 2005 | 503,118 |
| Sep 2006 | 369,938 |
| Sep 2007 | 395,371 |
| Sep 2008 | 364,202 |
Strategic Petroleum Reserve
The reserve held 541M bbl on Jan 26, 2001 and 703M bbl on Jan 23, 2009, with a high of 707M bbl on Aug 8, 2008.
Reserve level, million barrels
Data notes
Crude oil held in the Strategic Petroleum Reserve at the end of each week, in millions of barrels, from the Energy Information Administration (from August 1982). Sales, exchanges and refills are authorized by Congress and the executive branch at different times, and many take months to carry out. The Energy page marks each action.
View as table
| Period | Value |
|---|---|
| Jan 26, 2001 | 541M bbl |
| Feb 2, 2001 | 542M bbl |
| Feb 9, 2001 | 542M bbl |
| Feb 16, 2001 | 542M bbl |
| Feb 23, 2001 | 542M bbl |
| Mar 2, 2001 | 542M bbl |
| Mar 9, 2001 | 542M bbl |
| Mar 16, 2001 | 542M bbl |
| Mar 23, 2001 | 542M bbl |
| Mar 30, 2001 | 542M bbl |
| Apr 6, 2001 | 542M bbl |
| Apr 13, 2001 | 542M bbl |
| Apr 20, 2001 | 542M bbl |
| Apr 27, 2001 | 542M bbl |
| May 4, 2001 | 543M bbl |
| May 11, 2001 | 543M bbl |
| May 18, 2001 | 543M bbl |
| May 25, 2001 | 543M bbl |
| Jun 1, 2001 | 543M bbl |
| Jun 8, 2001 | 543M bbl |
| Jun 15, 2001 | 543M bbl |
| Jun 22, 2001 | 543M bbl |
| Jun 29, 2001 | 543M bbl |
| Jul 6, 2001 | 544M bbl |
| Jul 13, 2001 | 544M bbl |
| Jul 20, 2001 | 544M bbl |
| Jul 27, 2001 | 544M bbl |
| Aug 3, 2001 | 544M bbl |
| Aug 10, 2001 | 544M bbl |
| Aug 17, 2001 | 544M bbl |
| Aug 24, 2001 | 544M bbl |
| Aug 31, 2001 | 544M bbl |
| Sep 7, 2001 | 544M bbl |
| Sep 14, 2001 | 544M bbl |
| Sep 21, 2001 | 545M bbl |
| Sep 28, 2001 | 545M bbl |
| Oct 5, 2001 | 545M bbl |
| Oct 12, 2001 | 545M bbl |
| Oct 19, 2001 | 545M bbl |
| Oct 26, 2001 | 545M bbl |
| Nov 2, 2001 | 545M bbl |
| Nov 9, 2001 | 546M bbl |
| Nov 16, 2001 | 546M bbl |
| Nov 23, 2001 | 547M bbl |
| Nov 30, 2001 | 547M bbl |
| Dec 7, 2001 | 547M bbl |
| Dec 14, 2001 | 548M bbl |
| Dec 21, 2001 | 549M bbl |
| Dec 28, 2001 | 549M bbl |
| Jan 4, 2002 | 550M bbl |
| Jan 11, 2002 | 551M bbl |
| Jan 18, 2002 | 552M bbl |
| Jan 25, 2002 | 554M bbl |
| Feb 1, 2002 | 554M bbl |
| Feb 8, 2002 | 557M bbl |
| Feb 15, 2002 | 557M bbl |
| Feb 22, 2002 | 559M bbl |
| Mar 1, 2002 | 560M bbl |
| Mar 8, 2002 | 560M bbl |
| Mar 15, 2002 | 561M bbl |
| Mar 22, 2002 | 561M bbl |
| Mar 29, 2002 | 561M bbl |
| Apr 5, 2002 | 561M bbl |
| Apr 12, 2002 | 563M bbl |
| Apr 19, 2002 | 565M bbl |
| Apr 26, 2002 | 566M bbl |
| May 3, 2002 | 567M bbl |
| May 10, 2002 | 568M bbl |
| May 17, 2002 | 568M bbl |
| May 24, 2002 | 569M bbl |
| May 31, 2002 | 571M bbl |
| Jun 7, 2002 | 572M bbl |
| Jun 14, 2002 | 573M bbl |
| Jun 21, 2002 | 574M bbl |
| Jun 28, 2002 | 575M bbl |
| Jul 5, 2002 | 576M bbl |
| Jul 12, 2002 | 578M bbl |
| Jul 19, 2002 | 578M bbl |
| Jul 26, 2002 | 578M bbl |
| Aug 2, 2002 | 579M bbl |
| Aug 9, 2002 | 579M bbl |
| Aug 16, 2002 | 580M bbl |
| Aug 23, 2002 | 580M bbl |
| Aug 30, 2002 | 581M bbl |
| Sep 6, 2002 | 582M bbl |
| Sep 13, 2002 | 584M bbl |
| Sep 20, 2002 | 584M bbl |
| Sep 27, 2002 | 585M bbl |
| Oct 4, 2002 | 586M bbl |
| Oct 11, 2002 | 588M bbl |
| Oct 18, 2002 | 588M bbl |
| Oct 25, 2002 | 589M bbl |
| Nov 1, 2002 | 589M bbl |
| Nov 8, 2002 | 591M bbl |
| Nov 15, 2002 | 592M bbl |
| Nov 22, 2002 | 594M bbl |
| Nov 29, 2002 | 595M bbl |
| Dec 6, 2002 | 597M bbl |
| Dec 13, 2002 | 598M bbl |
| Dec 20, 2002 | 599M bbl |
| Dec 27, 2002 | 599M bbl |
| Jan 3, 2003 | 599M bbl |
| Jan 10, 2003 | 599M bbl |
| Jan 17, 2003 | 599M bbl |
| Jan 24, 2003 | 599M bbl |
| Jan 31, 2003 | 599M bbl |
| Feb 7, 2003 | 599M bbl |
| Feb 14, 2003 | 599M bbl |
| Feb 21, 2003 | 599M bbl |
| Feb 28, 2003 | 599M bbl |
| Mar 7, 2003 | 599M bbl |
| Mar 14, 2003 | 599M bbl |
| Mar 21, 2003 | 599M bbl |
| Mar 28, 2003 | 599M bbl |
| Apr 4, 2003 | 599M bbl |
| Apr 11, 2003 | 599M bbl |
| Apr 18, 2003 | 599M bbl |
| Apr 25, 2003 | 599M bbl |
| May 2, 2003 | 600M bbl |
| May 9, 2003 | 600M bbl |
| May 16, 2003 | 601M bbl |
| May 23, 2003 | 602M bbl |
| May 30, 2003 | 603M bbl |
| Jun 6, 2003 | 604M bbl |
| Jun 13, 2003 | 605M bbl |
| Jun 20, 2003 | 606M bbl |
| Jun 27, 2003 | 607M bbl |
| Jul 4, 2003 | 609M bbl |
| Jul 11, 2003 | 609M bbl |
| Jul 18, 2003 | 610M bbl |
| Jul 25, 2003 | 611M bbl |
| Aug 1, 2003 | 612M bbl |
| Aug 8, 2003 | 613M bbl |
| Aug 15, 2003 | 613M bbl |
| Aug 22, 2003 | 616M bbl |
| Aug 29, 2003 | 617M bbl |
| Sep 5, 2003 | 618M bbl |
| Sep 12, 2003 | 620M bbl |
| Sep 19, 2003 | 621M bbl |
| Sep 26, 2003 | 622M bbl |
| Oct 3, 2003 | 624M bbl |
| Oct 10, 2003 | 626M bbl |
| Oct 17, 2003 | 627M bbl |
| Oct 24, 2003 | 629M bbl |
| Oct 31, 2003 | 630M bbl |
| Nov 7, 2003 | 631M bbl |
| Nov 14, 2003 | 632M bbl |
| Nov 21, 2003 | 633M bbl |
| Nov 28, 2003 | 633M bbl |
| Dec 5, 2003 | 634M bbl |
| Dec 12, 2003 | 635M bbl |
| Dec 19, 2003 | 636M bbl |
| Dec 26, 2003 | 636M bbl |
| Jan 2, 2004 | 638M bbl |
| Jan 9, 2004 | 639M bbl |
| Jan 16, 2004 | 640M bbl |
| Jan 23, 2004 | 640M bbl |
| Jan 30, 2004 | 641M bbl |
| Feb 6, 2004 | 642M bbl |
| Feb 13, 2004 | 643M bbl |
| Feb 20, 2004 | 645M bbl |
| Feb 27, 2004 | 647M bbl |
| Mar 5, 2004 | 648M bbl |
| Mar 12, 2004 | 648M bbl |
| Mar 19, 2004 | 650M bbl |
| Mar 26, 2004 | 651M bbl |
| Apr 2, 2004 | 652M bbl |
| Apr 9, 2004 | 653M bbl |
| Apr 16, 2004 | 654M bbl |
| Apr 23, 2004 | 657M bbl |
| Apr 30, 2004 | 658M bbl |
| May 7, 2004 | 659M bbl |
| May 14, 2004 | 659M bbl |
| May 21, 2004 | 659M bbl |
| May 28, 2004 | 660M bbl |
| Jun 4, 2004 | 661M bbl |
| Jun 11, 2004 | 661M bbl |
| Jun 18, 2004 | 661M bbl |
| Jun 25, 2004 | 662M bbl |
| Jul 2, 2004 | 662M bbl |
| Jul 9, 2004 | 663M bbl |
| Jul 16, 2004 | 663M bbl |
| Jul 23, 2004 | 664M bbl |
| Jul 30, 2004 | 665M bbl |
| Aug 6, 2004 | 666M bbl |
| Aug 13, 2004 | 666M bbl |
| Aug 20, 2004 | 667M bbl |
| Aug 27, 2004 | 669M bbl |
| Sep 3, 2004 | 669M bbl |
| Sep 10, 2004 | 669M bbl |
| Sep 17, 2004 | 670M bbl |
| Sep 24, 2004 | 670M bbl |
| Oct 1, 2004 | 670M bbl |
| Oct 8, 2004 | 669M bbl |
| Oct 15, 2004 | 669M bbl |
| Oct 22, 2004 | 670M bbl |
| Oct 29, 2004 | 670M bbl |
| Nov 5, 2004 | 670M bbl |
| Nov 12, 2004 | 671M bbl |
| Nov 19, 2004 | 671M bbl |
| Nov 26, 2004 | 671M bbl |
| Dec 3, 2004 | 673M bbl |
| Dec 10, 2004 | 673M bbl |
| Dec 17, 2004 | 674M bbl |
| Dec 24, 2004 | 674M bbl |
| Dec 31, 2004 | 674M bbl |
| Jan 7, 2005 | 676M bbl |
| Jan 14, 2005 | 676M bbl |
| Jan 21, 2005 | 678M bbl |
| Jan 28, 2005 | 679M bbl |
| Feb 4, 2005 | 680M bbl |
| Feb 11, 2005 | 681M bbl |
| Feb 18, 2005 | 681M bbl |
| Feb 25, 2005 | 682M bbl |
| Mar 4, 2005 | 682M bbl |
| Mar 11, 2005 | 684M bbl |
| Mar 18, 2005 | 685M bbl |
| Mar 25, 2005 | 687M bbl |
| Apr 1, 2005 | 688M bbl |
| Apr 8, 2005 | 689M bbl |
| Apr 15, 2005 | 690M bbl |
| Apr 22, 2005 | 691M bbl |
| Apr 29, 2005 | 691M bbl |
| May 6, 2005 | 692M bbl |
| May 13, 2005 | 692M bbl |
| May 20, 2005 | 693M bbl |
| May 27, 2005 | 693M bbl |
| Jun 3, 2005 | 694M bbl |
| Jun 10, 2005 | 695M bbl |
| Jun 17, 2005 | 696M bbl |
| Jun 24, 2005 | 696M bbl |
| Jul 1, 2005 | 696M bbl |
| Jul 8, 2005 | 697M bbl |
| Jul 15, 2005 | 697M bbl |
| Jul 22, 2005 | 698M bbl |
| Jul 29, 2005 | 698M bbl |
| Aug 5, 2005 | 699M bbl |
| Aug 12, 2005 | 700M bbl |
| Aug 19, 2005 | 700M bbl |
| Aug 26, 2005 | 701M bbl |
| Sep 2, 2005 | 701M bbl |
| Sep 9, 2005 | 699M bbl |
| Sep 16, 2005 | 696M bbl |
| Sep 23, 2005 | 696M bbl |
| Sep 30, 2005 | 693M bbl |
| Oct 7, 2005 | 691M bbl |
| Oct 14, 2005 | 689M bbl |
| Oct 21, 2005 | 687M bbl |
| Oct 28, 2005 | 685M bbl |
| Nov 4, 2005 | 685M bbl |
| Nov 11, 2005 | 685M bbl |
| Nov 18, 2005 | 684M bbl |
| Nov 25, 2005 | 685M bbl |
| Dec 2, 2005 | 686M bbl |
| Dec 9, 2005 | 686M bbl |
| Dec 16, 2005 | 685M bbl |
| Dec 23, 2005 | 685M bbl |
| Dec 30, 2005 | 685M bbl |
| Jan 6, 2006 | 684M bbl |
| Jan 13, 2006 | 684M bbl |
| Jan 20, 2006 | 684M bbl |
| Jan 27, 2006 | 684M bbl |
| Feb 3, 2006 | 684M bbl |
| Feb 10, 2006 | 684M bbl |
| Feb 17, 2006 | 684M bbl |
| Feb 24, 2006 | 685M bbl |
| Mar 3, 2006 | 685M bbl |
| Mar 10, 2006 | 685M bbl |
| Mar 17, 2006 | 685M bbl |
| Mar 24, 2006 | 686M bbl |
| Mar 31, 2006 | 686M bbl |
| Apr 7, 2006 | 686M bbl |
| Apr 14, 2006 | 687M bbl |
| Apr 21, 2006 | 687M bbl |
| Apr 28, 2006 | 688M bbl |
| May 5, 2006 | 688M bbl |
| May 12, 2006 | 689M bbl |
| May 19, 2006 | 689M bbl |
| May 26, 2006 | 689M bbl |
| Jun 2, 2006 | 689M bbl |
| Jun 9, 2006 | 689M bbl |
| Jun 16, 2006 | 689M bbl |
| Jun 23, 2006 | 689M bbl |
| Jun 30, 2006 | 689M bbl |
| Jul 7, 2006 | 688M bbl |
| Jul 14, 2006 | 688M bbl |
| Jul 21, 2006 | 688M bbl |
| Jul 28, 2006 | 688M bbl |
| Aug 4, 2006 | 688M bbl |
| Aug 11, 2006 | 688M bbl |
| Aug 18, 2006 | 688M bbl |
| Aug 25, 2006 | 688M bbl |
| Sep 1, 2006 | 688M bbl |
| Sep 8, 2006 | 688M bbl |
| Sep 15, 2006 | 688M bbl |
| Sep 22, 2006 | 688M bbl |
| Sep 29, 2006 | 688M bbl |
| Oct 6, 2006 | 688M bbl |
| Oct 13, 2006 | 688M bbl |
| Oct 20, 2006 | 688M bbl |
| Oct 27, 2006 | 688M bbl |
| Nov 3, 2006 | 689M bbl |
| Nov 10, 2006 | 689M bbl |
| Nov 17, 2006 | 689M bbl |
| Nov 24, 2006 | 689M bbl |
| Dec 1, 2006 | 689M bbl |
| Dec 8, 2006 | 689M bbl |
| Dec 15, 2006 | 689M bbl |
| Dec 22, 2006 | 689M bbl |
| Dec 29, 2006 | 689M bbl |
| Jan 5, 2007 | 689M bbl |
| Jan 12, 2007 | 689M bbl |
| Jan 19, 2007 | 689M bbl |
| Jan 26, 2007 | 689M bbl |
| Feb 2, 2007 | 689M bbl |
| Feb 9, 2007 | 689M bbl |
| Feb 16, 2007 | 689M bbl |
| Feb 23, 2007 | 689M bbl |
| Mar 2, 2007 | 689M bbl |
| Mar 9, 2007 | 689M bbl |
| Mar 16, 2007 | 689M bbl |
| Mar 23, 2007 | 689M bbl |
| Mar 30, 2007 | 689M bbl |
| Apr 6, 2007 | 689M bbl |
| Apr 13, 2007 | 689M bbl |
| Apr 20, 2007 | 689M bbl |
| Apr 27, 2007 | 689M bbl |
| May 4, 2007 | 689M bbl |
| May 11, 2007 | 690M bbl |
| May 18, 2007 | 690M bbl |
| May 25, 2007 | 690M bbl |
| Jun 1, 2007 | 690M bbl |
| Jun 8, 2007 | 690M bbl |
| Jun 15, 2007 | 690M bbl |
| Jun 22, 2007 | 690M bbl |
| Jun 29, 2007 | 690M bbl |
| Jul 6, 2007 | 690M bbl |
| Jul 13, 2007 | 690M bbl |
| Jul 20, 2007 | 690M bbl |
| Jul 27, 2007 | 690M bbl |
| Aug 3, 2007 | 690M bbl |
| Aug 10, 2007 | 690M bbl |
| Aug 17, 2007 | 690M bbl |
| Aug 24, 2007 | 690M bbl |
| Aug 31, 2007 | 690M bbl |
| Sep 7, 2007 | 690M bbl |
| Sep 14, 2007 | 691M bbl |
| Sep 21, 2007 | 693M bbl |
| Sep 28, 2007 | 693M bbl |
| Oct 5, 2007 | 693M bbl |
| Oct 12, 2007 | 693M bbl |
| Oct 19, 2007 | 694M bbl |
| Oct 26, 2007 | 694M bbl |
| Nov 2, 2007 | 694M bbl |
| Nov 9, 2007 | 695M bbl |
| Nov 16, 2007 | 695M bbl |
| Nov 23, 2007 | 695M bbl |
| Nov 30, 2007 | 695M bbl |
| Dec 7, 2007 | 696M bbl |
| Dec 14, 2007 | 696M bbl |
| Dec 21, 2007 | 696M bbl |
| Dec 28, 2007 | 696M bbl |
| Jan 4, 2008 | 697M bbl |
| Jan 11, 2008 | 698M bbl |
| Jan 18, 2008 | 698M bbl |
| Jan 25, 2008 | 698M bbl |
| Feb 1, 2008 | 698M bbl |
| Feb 8, 2008 | 698M bbl |
| Feb 15, 2008 | 698M bbl |
| Feb 22, 2008 | 699M bbl |
| Feb 29, 2008 | 699M bbl |
| Mar 7, 2008 | 699M bbl |
| Mar 14, 2008 | 700M bbl |
| Mar 21, 2008 | 700M bbl |
| Mar 28, 2008 | 700M bbl |
| Apr 4, 2008 | 700M bbl |
| Apr 11, 2008 | 701M bbl |
| Apr 18, 2008 | 701M bbl |
| Apr 25, 2008 | 701M bbl |
| May 2, 2008 | 701M bbl |
| May 9, 2008 | 702M bbl |
| May 16, 2008 | 703M bbl |
| May 23, 2008 | 703M bbl |
| May 30, 2008 | 704M bbl |
| Jun 6, 2008 | 704M bbl |
| Jun 13, 2008 | 705M bbl |
| Jun 20, 2008 | 705M bbl |
| Jun 27, 2008 | 706M bbl |
| Jul 4, 2008 | 706M bbl |
| Jul 11, 2008 | 706M bbl |
| Jul 18, 2008 | 706M bbl |
| Jul 25, 2008 | 706M bbl |
| Aug 1, 2008 | 707M bbl |
| Aug 8, 2008 | 707M bbl |
| Aug 15, 2008 | 707M bbl |
| Aug 22, 2008 | 707M bbl |
| Aug 29, 2008 | 707M bbl |
| Sep 5, 2008 | 707M bbl |
| Sep 12, 2008 | 707M bbl |
| Sep 19, 2008 | 706M bbl |
| Sep 26, 2008 | 704M bbl |
| Oct 3, 2008 | 702M bbl |
| Oct 10, 2008 | 702M bbl |
| Oct 17, 2008 | 702M bbl |
| Oct 24, 2008 | 702M bbl |
| Oct 31, 2008 | 702M bbl |
| Nov 7, 2008 | 702M bbl |
| Nov 14, 2008 | 702M bbl |
| Nov 21, 2008 | 702M bbl |
| Nov 28, 2008 | 702M bbl |
| Dec 5, 2008 | 702M bbl |
| Dec 12, 2008 | 702M bbl |
| Dec 19, 2008 | 702M bbl |
| Dec 26, 2008 | 702M bbl |
| Jan 2, 2009 | 702M bbl |
| Jan 9, 2009 | 702M bbl |
| Jan 16, 2009 | 702M bbl |
| Jan 23, 2009 | 703M bbl |
Source: the site’s Presidency, Congress and Supreme Court data, each named in its card’s Data notes; party control of Congress from the House and Senate historians; appointments from the Federal Judicial Center. Portrait: public domain, via Wikimedia Commons. Built October 19, 2026.