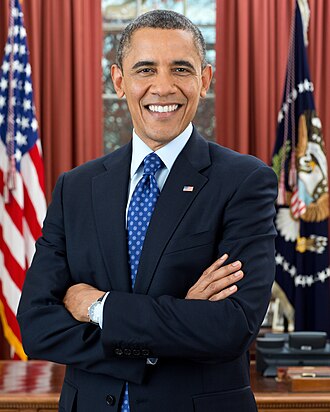
Barack Obama
44th president · Democrat · January 20, 2009 – January 19, 2017
Barack Hussein Obama II is an American retired politician who served as the 44th president of the United States from 2009 to 2017. A member of the Democratic Party, he was the first African American to serve as president. (Wikipedia, CC BY-SA 4.0)
How to read this
Each card takes a series from one of the site’s Presidency, Congress or Supreme Court pages and shows only the time Obama was in office. Monthly figures run from the month of the inauguration to the month the term ended; a fiscal or calendar year counts for the president who held office for most of its days. Cards whose data begins after 2009 say where it starts, and a card with no data for the term is left out.
These are conditions during a presidency, not a scorecard. Congress, the courts, the Federal Reserve, the business cycle and events abroad move every one of these numbers, and many policies take effect years after they are signed, so a change during a term is not a measure of what the president caused.
Who held power
Party control of Congress
Democrats held both chambers for 2 years, one chamber for 4 years and neither for 2 years.
- 115th Congress2017House: Rep.194 D · 241 RSenate: Rep.49 D · 51 R
- 114th Congress2015–2017House: Rep.188 D · 247 RSenate: Rep.46 D · 54 R
- 113th Congress2013–2015House: Rep.201 D · 234 RSenate: Dem.55 D · 45 R
- 112th Congress2011–2013House: Rep.193 D · 242 RSenate: Dem.53 D · 47 R
- 111th Congress2009–2011House: Dem.257 D · 178 RSenate: Dem.59 D · 41 R
Seats are at the start of each Congress. Democrats and Republicans include the independents who caucused with them.
Data notes
Supreme Court appointments
Barack Obama appointed 2 justices: Sotomayor (2009) and Kagan (2010).
 Elena Kagan · Associate justiceNominated May 10, 2010 · confirmed 63–37
 Sonia Sotomayor · Associate justiceNominated Jun 1, 2009 · confirmed 68–31
Data notes
A justice counts for the president who nominated them (a recess appointment from the day it began, if earlier). An associate justice later made chief by another president, like William Rehnquist, counts as an elevation for the second. Failed and withdrawn nominations are not listed. Dates and Senate votes from the Federal Judicial Center.
Laws and orders
Laws signed
Signed 1,289 laws, 45 of them major laws. Congress enacted 1 more over a veto.
Laws signed per year in office
By policy area
- Commemorations338 (26%)
- Government, justice & rights232 (18%)
- Economy, taxes & trade171 (13%)
- Defense & foreign affairs149 (12%)
- Land, water & farming139 (11%)
- Health, education & culture122 (9%)
- Transport, housing & emergencies107 (8%)
- Energy & environment31 (2%)
Data notes
Public laws whose enactment date falls in the term, from Congress.gov (93rd Congress, 1973, on; private laws left out), counted through 2026-10-15. A law enacted over a veto is not counted as signed; a bill that became law without a signature is. A bar is one year in office, from the inauguration to the day before its anniversary. Policy areas are the Congressional Research Service’s, grouped as on the Laws page.
View as table
| Period | Value |
|---|---|
| 2009–10 | 124 |
| 2010–11 | 258 |
| 2011–12 | 90 |
| 2012–13 | 194 |
| 2013–14 | 75 |
| 2014–15 | 221 |
| 2015–16 | 114 |
| 2016–17 | 213 |
Executive orders
Signed 276 executive orders; the most common topic was government operations (76).
Executive orders per year in office
By topic
- Government operations76 (28%)
- Foreign policy55 (20%)
- Economy, labor & technology42 (15%)
- National security & defense39 (14%)
- Health & education23 (8%)
- Energy & environment21 (8%)
- Trade & tariffs12 (4%)
- Immigration & justice5 (2%)
- Civil rights & civic life3 (1%)
Data notes
Executive orders signed in the term, from the Federal Register, whose electronic record begins in 1994. Each order has one primary topic, assigned as on the Executive orders page. Counts say how many orders were signed, not how much they did: one order can set up a program or rename an office. A bar is one year in office.
View as table
| Period | Value |
|---|---|
| 2009–10 | 41 |
| 2010–11 | 34 |
| 2011–12 | 34 |
| 2012–13 | 38 |
| 2013–14 | 21 |
| 2014–15 | 32 |
| 2015–16 | 28 |
| 2016–17 | 48 |
Major laws signed
45 of the laws Obama signed are counted as important enactments, newest first, with how each passed the House and Senate.
- Dec 16, 2016WIIN ActLand, water & farmingHouse360–61 (360 yea, 61 nay)Senate78–21 (78 yea, 21 nay)
- Dec 13, 201621st Century Cures ActHealth, education & cultureHouse392–26 (392 yea, 26 nay)Senate94–5 (94 yea, 5 nay)
- Jul 22, 2016Comprehensive Addiction and Recovery Act of 2016Government, justice & rightsHouse407–5 (407 yea, 5 nay)Senate92–2 (92 yea, 2 nay)
- Jun 30, 2016Puerto Rico Oversight, Management, and Economic Stability ActEconomy, taxes & tradePuerto Rico Oversight, Management, and Economic Stability Act or PROMESA This bill addresses Puerto Rico's debt by establishing an oversight board, a process for restructuring debt, and expedited procedures for approving critical infrastructure projects.HouseMethod not statedSenate68–30 (68 yea, 30 nay)
- Dec 18, 2015Consolidated Appropriations Act, 2016Economy, taxes & tradeHighlights: The Consolidated Appropriations Act, 2016 provides FY2016 appropriations; extends expiring tax provisions; and affects policies in areas including oil exports, intelligence, cybersecurity, health care, financial services, visa waivers, and conservation.House316–113 (316 yea, 113 nay)Senate65–33 (65 yea, 33 nay)
- Dec 10, 2015Every Student Succeeds ActHealth, education & cultureHouse359–64 (359 yea, 64 nay)Senate85–12 (85 yea, 12 nay)
- Dec 4, 2015FAST ActTransport, housing & emergenciesHouse359–65 (359 yea, 65 nay)Senate83–16 (83 yea, 16 nay)
- Nov 2, 2015Bipartisan Budget Act of 2015Economy, taxes & tradeBipartisan Budget Act of 2015 TITLE I--BUDGET ENFORCEMENT (Sec. 101) This bill amends the Balanced Budget and Emergency Deficit Control Act of 1985 to increase the discretionary spending limits for FY2016 and FY2017.House266–167 (266 yea, 167 nay)Senate64–35 (64 yea, 35 nay)
- Jun 29, 2015Trade Preferences Extension Act of 2015Economy, taxes & tradeHouse286–138 (286 yea, 138 nay)SenateVoice vote
- Jun 2, 2015USA FREEDOM Act of 2015Defense & foreign affairsHouse338–88 (338 yea, 88 nay)Senate67–32 (67 yea, 32 nay)
- Apr 16, 2015Medicare Access and CHIP Reauthorization Act of 2015Health, education & cultureHouse392–37 (392 yea, 37 nay)Senate92–8 (92 yea, 8 nay)
- Dec 16, 2014Consolidated and Further Continuing Appropriations Act, 2015Economy, taxes & tradeHighlights: The Consolidated and Further Continuing Appropriations Act, 2015 provides appropriations for most of the federal government through the end of FY2015 and continuing appropriations for the Department of Homeland Security through February 27, 2015.House219–206 (219 yea, 206 nay)Senate56–40 (56 yea, 40 nay)
- Sep 19, 2014Continuing Appropriations Resolution, 2015Economy, taxes & tradeHighlights: The Continuing Appropriations Resolution, 2015 provides continuing FY2015 appropriations to federal agencies until December 11, 2014, or enactment of specified appropriations legislation.House319–108 (319 yea, 108 nay)Senate78–22 (78 yea, 22 nay)
- Aug 7, 2014Veterans Access, Choice, and Accountability Act of 2014Defense & foreign affairsHouse420–5 (420 yea, 5 nay)Senate91–3 (91 yea, 3 nay)
- Jun 10, 2014Water Resources Reform and Development Act of 2014Land, water & farmingHouse412–4 (412 yea, 4 nay)Senate91–7 (91 yea, 7 nay)
- Feb 7, 2014Agricultural Act of 2014Land, water & farmingRepeals - (Sec. 1101) Repeals: (1) direct payments under the Food, Conservation, and Energy Act of 2008; and (2) countercyclical payments and the average crop revenue election program (ACRE) under the Food, Conservation, and Energy Act of 2008.House251–166 (251 yea, 166 nay)Senate68–32 (68 yea, 32 nay)
- Dec 26, 2013National Defense Authorization Act for Fiscal Year 2014Defense & foreign affairsAuthorizes appropriations for FY2014 for the Department of Defense (DOD) for procurement for the Army, Navy and Marine Corps, Air Force, and defense-wide activities, in amounts specified in the funding table set forth in Division D of this Act.HouseMethod not statedSenate84–15 (84 yea, 15 nay)
- Aug 9, 2013Bipartisan Student Loan Certainty Act of 2013Health, education & cultureAmends title IV (Student Assistance) of the Higher Education Act of 1965 (HEA) to set the annual interest rate on Direct Stafford loans and Direct Unsubsidized Stafford loans issued to undergraduate students at the rate on high-yield 10-year Treasury notes plus 2.05%, but caps that rate at 8.25%.House392–31 (392 yea, 31 nay)Senate81–18 (81 yea, 18 nay)
- Mar 7, 2013Violence Against Women Reauthorization Act of 2013Government, justice & rightsHouse286–138 (286 yea, 138 nay)Senate78–22 (78 yea, 22 nay)
- Jan 29, 2013Making supplemental appropriations for the fiscalyear ending September 30, 2013, to improve andstreamline disaster assistance for HurricaneSandy, and for other purposes.Transport, housing & emergenciesMakes supplemental appropriations for FY2013 to specified federal agencies and programs for expenses related to the consequences of Hurricane Sandy.House241–180 (241 yea, 180 nay)Senate62–36 (62 yea, 36 nay)
- Jan 6, 2013To temporarily increase the borrowing authority of the Federal Emergency Management Agency for carrying out the National Flood Insurance Program.Transport, housing & emergenciesHouse354–67 (354 yea, 67 nay)SenateVoice vote
- Jan 2, 2013American Taxpayer Relief Act of 2012Economy, taxes & tradeMakes permanent the Economic Growth and Tax Relief Reconciliation Act of 2001 for individual taxpayers whose taxable income is at or below a $400,000 threshold amount ($450,000 for married couples filing a joint return).House257–167 (257 yea, 167 nay)Senate89–8 (89 yea, 8 nay)
- Dec 14, 2012Russia and Moldova Jackson-Vanik Repeal and Sergei Magnitsky Rule of Law Accountability Act of 2012Economy, taxes & tradeHouse365–43 (365 yea, 43 nay)Senate92–4 (92 yea, 4 nay)
- Apr 5, 2012Jumpstart Our Business StartupsEconomy, taxes & tradeAmends the Securities Act of 1933 (SA) and the Securities Exchange Act of 1934 (SEA) to define "emerging growth company" as an issuer that had total annual gross revenues of less than $1 billion during its most recently completed fiscal year.House380–41 (380 yea, 41 nay)Senate73–26 (73 yea, 26 nay)
- Apr 4, 2012STOCK ActGovernment, justice & rightsHouse417–2 (417 yea, 2 nay)SenateUnanimous consent
- Oct 21, 2011United States-Panama Trade Promotion Agreement Implementation ActEconomy, taxes & tradeApproves the United States-Panama Trade Promotion Agreement (the Agreement) entered into on June 28, 2007, with the government of Panama, and the statement of administrative action proposed to implement the Agreement, both submitted to Congress on October 3, 2011.House300–129 (300 yea, 129 nay)Senate77–22 (77 yea, 22 nay)
- Oct 21, 2011United States-Colombia Trade Promotion Agreement Implementation ActEconomy, taxes & tradeHouse262–167 (262 yea, 167 nay)Senate66–33 (66 yea, 33 nay)
- Oct 21, 2011United States-Korea Free Trade Agreement Implementation ActEconomy, taxes & tradeApproves the United States-Korea Free Trade Agreement (the Agreement) entered into on June 30, 2007, with the government of Korea, and the statement of administrative action proposed to implement the Agreement, both submitted to Congress on October 3, 2011.House278–151 (278 yea, 151 nay)Senate83–15 (83 yea, 15 nay)
- Sep 16, 2011Leahy-Smith America Invents ActEconomy, taxes & tradeHouse304–117 (304 yea, 117 nay)Senate89–9 (89 yea, 9 nay)
- Aug 2, 2011Budget Control Act of 2011Health, education & cultureAmends the Balanced Budget and Emergency Deficit Control Act of 1985 (Gramm-Rudman-Hollings Act) to revise sequestration requirements for enforcement of discretionary spending limits (spending caps).House269–161 (269 yea, 161 nay)Senate74–26 (74 yea, 26 nay)
- Jan 4, 2011FDA Food Safety Modernization ActTransport, housing & emergenciesAmends the Federal Food, Drug, and Cosmetic Act (FFDCA) to expand the food safety activities of the Secretary of Health and Human Services (HHS), including to authorize the Secretary to inspect records related to food.House215–144 (215 yea, 144 nay)SenateVoice vote
- Jan 2, 2011James Zadroga 9/11 Health and Compensation Act of 2010Health, education & cultureHouse206–60 (206 yea, 60 nay)SenateVoice vote
- Dec 22, 2010Don't Ask, Don't Tell Repeal Act of 2010Economy, taxes & tradeHouse250–175 (250 yea, 175 nay)Senate65–31 (65 yea, 31 nay)
- Dec 17, 2010Tax Relief, Unemployment Insurance Reauthorization, and Job Creation Act of 2010Transport, housing & emergenciesHouse277–148 (277 yea, 148 nay)Senate81–19 (81 yea, 19 nay)
- Jul 21, 2010Dodd-Frank Wall Street Reform and Consumer Protection ActEconomy, taxes & tradeEstablishes the Financial Stability Oversight Council (Council), consisting of the heads of specified federal financial regulatory bodies and chaired by the Secretary of the Treasury.House237–192 (237 yea, 192 nay)Senate60–39 (60 yea, 39 nay)
- Mar 30, 2010Health Care and Education Reconciliation Act of 2010Health, education & cultureHouse220–207 (220 yea, 207 nay)Senate56–43 (56 yea, 43 nay)
- Mar 23, 2010Patient Protection and Affordable Care ActHealth, education & cultureHouse219–212 (219 yea, 212 nay)Senate60–39 (60 yea, 39 nay)
- Oct 28, 2009National Defense Authorization Act for Fiscal Year 2010Defense & foreign affairsAuthorizes appropriations for FY2010 for the Army, Navy and Marine Corps, and Air Force for aircraft, missiles, weapons and tracked combat vehicles, ammunition, shipbuilding and conversion, and other procurement.House281–146 (281 yea, 146 nay)Senate68–29 (68 yea, 29 nay)
- Jun 22, 2009Family Smoking Prevention and Tobacco Control ActHealth, education & cultureAmends the Federal Food, Drug, and Cosmetic Act (FFDCA) to provide for the regulation of tobacco products by the Secretary of Health and Human Services through the Food and Drug Administration (FDA).House307–97 (307 yea, 97 nay)Senate79–17 (79 yea, 17 nay)
- May 22, 2009Credit CARD Act of 2009Economy, taxes & tradeAuthorizes the Board of Governors of the Federal Reserve System (Federal Reserve Board) to issue rules and publish model forms to implement this Act.House279–147 (279 yea, 147 nay)Senate90–5 (90 yea, 5 nay)
- Apr 21, 2009Serve America ActHealth, education & cultureAmends the National and Community Service Act of 1990 (NCSA) and the Domestic Volunteer Service Act of 1973 (DVSA) to revise their programs and reauthorize appropriations for them through FY2014.House275–149 (275 yea, 149 nay)Senate79–19 (79 yea, 19 nay)
- Mar 30, 2009Omnibus Public Land Management Act of 2009Land, water & farmingDesignates specified federal lands in the Monongahela National Forest, West Virginia, as wilderness and as either a new component, or an addition to an existing component, of the National Wilderness Preservation System.House285–140 (285 yea, 140 nay)Senate77–20 (77 yea, 20 nay)
- Feb 17, 2009American Recovery and Reinvestment Act of 2009Economy, taxes & tradeDesignates each amount in this Act as: (1) an emergency requirement, necessary to meet certain emergency needs in accordance with the FY2008-FY2009 congressional budget resolutions; and (2) an emergency for Pay-As-You-Go (PAYGO) principles.House246–183 (246 yea, 183 nay)Senate60–38 (60 yea, 38 nay)
- Feb 4, 2009Children's Health Insurance Program Reauthorization Act of 2009Health, education & cultureMakes the amendments made by this Act effective on April 1, 2009, regardless of whether final regulations have been promulgated to carry them out.House290–135 (290 yea, 135 nay)Senate66–32 (66 yea, 32 nay)
- Jan 29, 2009Lilly Ledbetter Fair Pay Act of 2009Government, justice & rightsHouse250–177 (250 yea, 177 nay)Senate61–36 (61 yea, 36 nay)
Data notes
Laws counted as important enactments, the same list the Laws page uses for its “Major law” badge, which explains where it comes from. The list does not yet cover a Congress still in session. Each summary is the first sentence of the Congressional Research Service summary, where one stands alone; votes are each chamber’s final-passage tally, or how it passed without a recorded vote.
Economy
Misery index
The misery index (unemployment plus inflation) was 7.7 in January 2009 and 7.2 in January 2017, with a high of 12.8 in September 2011.
Misery index
Unemployment and inflation
Data notes
The misery index adds the unemployment rate to inflation (consumer prices, change from a year earlier) for the same month. Unemployment is the BLS rate, seasonally adjusted, from 1948; inflation is from the consumer price index, from 1948. The first reading is the month the president took office, the last the month the term ended. Both are national averages and are revised.
View as table
| Period | Value |
|---|---|
| Jan 2009 | 7.7 |
| Feb 2009 | 8.3 |
| Mar 2009 | 8.3 |
| Apr 2009 | 8.4 |
| May 2009 | 8.4 |
| Jun 2009 | 8.3 |
| Jul 2009 | 7.5 |
| Aug 2009 | 8.1 |
| Sep 2009 | 8.4 |
| Oct 2009 | 9.8 |
| Nov 2009 | 11.8 |
| Dec 2009 | 12.7 |
| Jan 2010 | 12.4 |
| Feb 2010 | 12 |
| Mar 2010 | 12.2 |
| Apr 2010 | 12.1 |
| May 2010 | 11.6 |
| Jun 2010 | 10.5 |
| Jul 2010 | 10.7 |
| Aug 2010 | 10.7 |
| Sep 2010 | 10.6 |
| Oct 2010 | 10.6 |
| Nov 2010 | 10.9 |
| Dec 2010 | 10.7 |
| Jan 2011 | 10.8 |
| Feb 2011 | 11.1 |
| Mar 2011 | 11.6 |
| Apr 2011 | 12.2 |
| May 2011 | 12.5 |
| Jun 2011 | 12.6 |
| Jul 2011 | 12.6 |
| Aug 2011 | 12.8 |
| Sep 2011 | 12.8 |
| Oct 2011 | 12.3 |
| Nov 2011 | 12.1 |
| Dec 2011 | 11.6 |
| Jan 2012 | 11.3 |
| Feb 2012 | 11.2 |
| Mar 2012 | 10.8 |
| Apr 2012 | 10.5 |
| May 2012 | 9.9 |
| Jun 2012 | 9.9 |
| Jul 2012 | 9.6 |
| Aug 2012 | 9.8 |
| Sep 2012 | 9.7 |
| Oct 2012 | 10 |
| Nov 2012 | 9.5 |
| Dec 2012 | 9.7 |
| Jan 2013 | 9.7 |
| Feb 2013 | 9.7 |
| Mar 2013 | 9 |
| Apr 2013 | 8.7 |
| May 2013 | 8.9 |
| Jun 2013 | 9.2 |
| Jul 2013 | 9.2 |
| Aug 2013 | 8.7 |
| Sep 2013 | 8.3 |
| Oct 2013 | 8.1 |
| Nov 2013 | 8.1 |
| Dec 2013 | 8.2 |
| Jan 2014 | 8.2 |
| Feb 2014 | 7.8 |
| Mar 2014 | 8.3 |
| Apr 2014 | 8.2 |
| May 2014 | 8.5 |
| Jun 2014 | 8.2 |
| Jul 2014 | 8.2 |
| Aug 2014 | 7.8 |
| Sep 2014 | 7.6 |
| Oct 2014 | 7.3 |
| Nov 2014 | 7 |
| Dec 2014 | 6.3 |
| Jan 2015 | 5.5 |
| Feb 2015 | 5.4 |
| Mar 2015 | 5.4 |
| Apr 2015 | 5.3 |
| May 2015 | 5.6 |
| Jun 2015 | 5.5 |
| Jul 2015 | 5.4 |
| Aug 2015 | 5.3 |
| Sep 2015 | 5 |
| Oct 2015 | 5.1 |
| Nov 2015 | 5.5 |
| Dec 2015 | 5.6 |
| Jan 2016 | 6 |
| Feb 2016 | 5.7 |
| Mar 2016 | 5.9 |
| Apr 2016 | 6.3 |
| May 2016 | 5.9 |
| Jun 2016 | 6 |
| Jul 2016 | 5.7 |
| Aug 2016 | 6 |
| Sep 2016 | 6.5 |
| Oct 2016 | 6.6 |
| Nov 2016 | 6.4 |
| Dec 2016 | 6.8 |
| Jan 2017 | 7.2 |
| Period | Unemployment rate | Inflation |
|---|---|---|
| Jan 2009 | 7.8% | −0.1% |
| Feb 2009 | 8.3% | 0% |
| Mar 2009 | 8.7% | −0.4% |
| Apr 2009 | 9% | −0.6% |
| May 2009 | 9.4% | −1% |
| Jun 2009 | 9.5% | −1.2% |
| Jul 2009 | 9.5% | −2% |
| Aug 2009 | 9.6% | −1.5% |
| Sep 2009 | 9.8% | −1.4% |
| Oct 2009 | 10% | −0.2% |
| Nov 2009 | 9.9% | 1.9% |
| Dec 2009 | 9.9% | 2.8% |
| Jan 2010 | 9.8% | 2.6% |
| Feb 2010 | 9.8% | 2.2% |
| Mar 2010 | 9.9% | 2.3% |
| Apr 2010 | 9.9% | 2.2% |
| May 2010 | 9.6% | 2% |
| Jun 2010 | 9.4% | 1.1% |
| Jul 2010 | 9.4% | 1.3% |
| Aug 2010 | 9.5% | 1.2% |
| Sep 2010 | 9.5% | 1.1% |
| Oct 2010 | 9.4% | 1.2% |
| Nov 2010 | 9.8% | 1.1% |
| Dec 2010 | 9.3% | 1.4% |
| Jan 2011 | 9.1% | 1.7% |
| Feb 2011 | 9% | 2.1% |
| Mar 2011 | 9% | 2.6% |
| Apr 2011 | 9.1% | 3.1% |
| May 2011 | 9% | 3.5% |
| Jun 2011 | 9.1% | 3.5% |
| Jul 2011 | 9% | 3.6% |
| Aug 2011 | 9% | 3.8% |
| Sep 2011 | 9% | 3.8% |
| Oct 2011 | 8.8% | 3.5% |
| Nov 2011 | 8.6% | 3.5% |
| Dec 2011 | 8.5% | 3.1% |
| Jan 2012 | 8.3% | 3% |
| Feb 2012 | 8.3% | 2.9% |
| Mar 2012 | 8.2% | 2.6% |
| Apr 2012 | 8.2% | 2.3% |
| May 2012 | 8.2% | 1.7% |
| Jun 2012 | 8.2% | 1.7% |
| Jul 2012 | 8.2% | 1.4% |
| Aug 2012 | 8.1% | 1.7% |
| Sep 2012 | 7.8% | 1.9% |
| Oct 2012 | 7.8% | 2.2% |
| Nov 2012 | 7.7% | 1.8% |
| Dec 2012 | 7.9% | 1.8% |
| Jan 2013 | 8% | 1.7% |
| Feb 2013 | 7.7% | 2% |
| Mar 2013 | 7.5% | 1.5% |
| Apr 2013 | 7.6% | 1.1% |
| May 2013 | 7.5% | 1.4% |
| Jun 2013 | 7.5% | 1.7% |
| Jul 2013 | 7.3% | 1.9% |
| Aug 2013 | 7.2% | 1.5% |
| Sep 2013 | 7.2% | 1.1% |
| Oct 2013 | 7.2% | 0.9% |
| Nov 2013 | 6.9% | 1.2% |
| Dec 2013 | 6.7% | 1.5% |
| Jan 2014 | 6.6% | 1.6% |
| Feb 2014 | 6.7% | 1.1% |
| Mar 2014 | 6.7% | 1.6% |
| Apr 2014 | 6.2% | 2% |
| May 2014 | 6.3% | 2.2% |
| Jun 2014 | 6.1% | 2.1% |
| Jul 2014 | 6.2% | 2% |
| Aug 2014 | 6.1% | 1.7% |
| Sep 2014 | 5.9% | 1.7% |
| Oct 2014 | 5.7% | 1.6% |
| Nov 2014 | 5.8% | 1.2% |
| Dec 2014 | 5.6% | 0.7% |
| Jan 2015 | 5.7% | −0.2% |
| Feb 2015 | 5.5% | −0.1% |
| Mar 2015 | 5.4% | −0% |
| Apr 2015 | 5.4% | −0.1% |
| May 2015 | 5.6% | 0% |
| Jun 2015 | 5.3% | 0.2% |
| Jul 2015 | 5.2% | 0.2% |
| Aug 2015 | 5.1% | 0.2% |
| Sep 2015 | 5% | 0% |
| Oct 2015 | 5% | 0.1% |
| Nov 2015 | 5.1% | 0.4% |
| Dec 2015 | 5% | 0.6% |
| Jan 2016 | 4.8% | 1.2% |
| Feb 2016 | 4.9% | 0.8% |
| Mar 2016 | 5% | 0.9% |
| Apr 2016 | 5.1% | 1.2% |
| May 2016 | 4.8% | 1.1% |
| Jun 2016 | 4.9% | 1.1% |
| Jul 2016 | 4.8% | 0.9% |
| Aug 2016 | 4.9% | 1.1% |
| Sep 2016 | 5% | 1.5% |
| Oct 2016 | 4.9% | 1.7% |
| Nov 2016 | 4.7% | 1.7% |
| Dec 2016 | 4.7% | 2.1% |
| Jan 2017 | 4.7% | 2.5% |
Federal deficit and debt
The federal budget balance, as a share of GDP, was −9.8% in FY2009 and −3.1% in FY2016, with a high of −2.4% in FY2015.
Budget balance, % of GDP
Public debt, % of GDP
Data notes
The budget balance is the federal surplus (above zero) or deficit (below) as a share of GDP, by fiscal year (July to June through 1976, October to September since); a year counts for the president in office for most of it, though its budget was usually passed the year before. Debt is total public debt as a share of GDP, quarterly from 1966, including debt the government holds in its own trust funds.
View as table
| Period | Value |
|---|---|
| FY2009 | −9.8% |
| FY2010 | −8.6% |
| FY2011 | −8.3% |
| FY2012 | −6.6% |
| FY2013 | −4% |
| FY2014 | −2.8% |
| FY2015 | −2.4% |
| FY2016 | −3.1% |
| Period | Value |
|---|---|
| Q1 2009 | 77.1% |
| Q2 2009 | 80.3% |
| Q3 2009 | 82.4% |
| Q4 2009 | 84% |
| Q1 2010 | 86.5% |
| Q2 2010 | 88.1% |
| Q3 2010 | 89.6% |
| Q4 2010 | 91.6% |
| Q1 2011 | 93% |
| Q2 2011 | 92.2% |
| Q3 2011 | 94.5% |
| Q4 2011 | 96.1% |
| Q1 2012 | 97.1% |
| Q2 2012 | 97.8% |
| Q3 2012 | 98.4% |
| Q4 2012 | 100.1% |
| Q1 2013 | 100.7% |
| Q2 2013 | 100.1% |
| Q3 2013 | 98.7% |
| Q4 2013 | 99.8% |
| Q1 2014 | 102.3% |
| Q2 2014 | 100.7% |
| Q3 2014 | 100.1% |
| Q4 2014 | 101.3% |
| Q1 2015 | 100.5% |
| Q2 2015 | 99.3% |
| Q3 2015 | 98.6% |
| Q4 2015 | 102.6% |
| Q1 2016 | 104% |
| Q2 2016 | 103.6% |
| Q3 2016 | 103.6% |
| Q4 2016 | 104.6% |
| Q1 2017 | 102.9% |
Immigration
Green cards and refugees
New green cards numbered 1.13M in FY2009 and 1.18M in FY2016, with a low of 991k in FY2013.
Green cards
Refugee admissions
Data notes
Green cards are people who became lawful permanent residents in the fiscal year, from the DHS Yearbook of Immigration Statistics (from FY1977). Refugee admissions are from the State Department’s Refugee Processing Center (from FY1980). A fiscal year counts for the administration in office for most of its days; a hatched bar is preliminary.
View as table
| Period | Value |
|---|---|
| FY2009 | 1,130,818 |
| FY2010 | 1,042,625 |
| FY2011 | 1,062,040 |
| FY2012 | 1,031,631 |
| FY2013 | 990,553 |
| FY2014 | 1,016,518 |
| FY2015 | 1,051,030 |
| FY2016 | 1,183,510 |
| Period | Value |
|---|---|
| FY2009 | 74,654 |
| FY2010 | 73,311 |
| FY2011 | 56,424 |
| FY2012 | 58,238 |
| FY2013 | 69,926 |
| FY2014 | 69,987 |
| FY2015 | 69,933 |
| FY2016 | 84,994 |
Removals and border encounters
Removals numbered 390k in FY2009 and 240k in FY2016, with a high of 410k in FY2012.
Removals
Border encounters
Data notes
Removals are formal deportations: the Immigration and Naturalization Service’s through FY2002 (DHS Yearbook) and ICE’s own count from FY2003 (ICE); the two are not the same measure. Border encounters are Border Patrol apprehensions, plus port-of-entry inadmissibles from FY2004 and Title 42 expulsions in FY2020–23 (CBP); they count events, not people. A hatched bar is preliminary.
View as table
| Period | Value |
|---|---|
| FY2009 | 389,834 |
| FY2010 | 392,862 |
| FY2011 | 396,906 |
| FY2012 | 409,849 |
| FY2013 | 368,644 |
| FY2014 | 315,943 |
| FY2015 | 235,413 |
| FY2016 | 240,255 |
| Period | Value |
|---|---|
| FY2009 | 779,951 |
| FY2010 | 692,962 |
| FY2011 | 553,602 |
| FY2012 | 560,568 |
| FY2013 | 626,409 |
| FY2014 | 711,671 |
| FY2015 | 592,459 |
| FY2016 | 690,637 |
The U.S. and the world
Goods trade balance
The monthly goods trade balance was −$46.7B in January 2009 and −$65.8B in January 2017, with a high of −$35.4B in May 2009.
Goods balance, $B a month
Data notes
The goods trade balance is exports minus imports of goods, in billions of dollars a month, seasonally adjusted, on the Census basis, from 1991 (Census Bureau). Below zero the U.S. imported more goods than it exported. Services are not included. Dollars are not adjusted for inflation, so later years run larger.
View as table
| Period | Value |
|---|---|
| Jan 2009 | −$46.7B |
| Feb 2009 | −$36.9B |
| Mar 2009 | −$38.4B |
| Apr 2009 | −$39.5B |
| May 2009 | −$35.4B |
| Jun 2009 | −$36.4B |
| Jul 2009 | −$42.1B |
| Aug 2009 | −$41B |
| Sep 2009 | −$44.6B |
| Oct 2009 | −$44.5B |
| Nov 2009 | −$48.8B |
| Dec 2009 | −$49.3B |
| Jan 2010 | −$48.5B |
| Feb 2010 | −$51B |
| Mar 2010 | −$50.5B |
| Apr 2010 | −$51.3B |
| May 2010 | −$52.6B |
| Jun 2010 | −$57.7B |
| Jul 2010 | −$52.4B |
| Aug 2010 | −$57.1B |
| Sep 2010 | −$56.1B |
| Oct 2010 | −$52.6B |
| Nov 2010 | −$51.4B |
| Dec 2010 | −$54.3B |
| Jan 2011 | −$61.4B |
| Feb 2011 | −$58.5B |
| Mar 2011 | −$58.6B |
| Apr 2011 | −$56.7B |
| May 2011 | −$61.7B |
| Jun 2011 | −$64.1B |
| Jul 2011 | −$60.7B |
| Aug 2011 | −$60.6B |
| Sep 2011 | −$58.3B |
| Oct 2011 | −$59.4B |
| Nov 2011 | −$61.5B |
| Dec 2011 | −$63.9B |
| Jan 2012 | −$65.7B |
| Feb 2012 | −$59.5B |
| Mar 2012 | −$66.1B |
| Apr 2012 | −$63.3B |
| May 2012 | −$61.7B |
| Jun 2012 | −$59.4B |
| Jul 2012 | −$58.9B |
| Aug 2012 | −$60.2B |
| Sep 2012 | −$56.6B |
| Oct 2012 | −$59.5B |
| Nov 2012 | −$63.8B |
| Dec 2012 | −$55.8B |
| Jan 2013 | −$59.9B |
| Feb 2013 | −$60.7B |
| Mar 2013 | −$54.8B |
| Apr 2013 | −$57.5B |
| May 2013 | −$61.4B |
| Jun 2013 | −$54.7B |
| Jul 2013 | −$57B |
| Aug 2013 | −$57B |
| Sep 2013 | −$60.7B |
| Oct 2013 | −$56.8B |
| Nov 2013 | −$54.2B |
| Dec 2013 | −$54.6B |
| Jan 2014 | −$58.8B |
| Feb 2014 | −$60.5B |
| Mar 2014 | −$62.5B |
| Apr 2014 | −$65.3B |
| May 2014 | −$61.3B |
| Jun 2014 | −$60.1B |
| Jul 2014 | −$60.5B |
| Aug 2014 | −$58.2B |
| Sep 2014 | −$62.6B |
| Oct 2014 | −$61B |
| Nov 2014 | −$60.1B |
| Dec 2014 | −$63.7B |
| Jan 2015 | −$60.6B |
| Feb 2015 | −$56.2B |
| Mar 2015 | −$71B |
| Apr 2015 | −$61.2B |
| May 2015 | −$60.3B |
| Jun 2015 | −$64.1B |
| Jul 2015 | −$61.4B |
| Aug 2015 | −$65.4B |
| Sep 2015 | −$62.2B |
| Oct 2015 | −$60.9B |
| Nov 2015 | −$60.7B |
| Dec 2015 | −$61.4B |
| Jan 2016 | −$60.3B |
| Feb 2016 | −$63B |
| Mar 2016 | −$57.1B |
| Apr 2016 | −$58.5B |
| May 2016 | −$60.7B |
| Jun 2016 | −$63.8B |
| Jul 2016 | −$62.3B |
| Aug 2016 | −$61.5B |
| Sep 2016 | −$59.5B |
| Oct 2016 | −$60.4B |
| Nov 2016 | −$65.8B |
| Dec 2016 | −$62.5B |
| Jan 2017 | −$65.8B |
Foreign aid
Foreign aid disbursed came to $44.7B in FY2009 and $46.8B in FY2016, with a high of $48.4B in FY2015. Afghanistan received the most in 8 of those years.
Disbursed, $ billions
Data notes
U.S. foreign assistance disbursed in each fiscal year, every country plus regional and global programs, in billions of dollars not adjusted for inflation, from ForeignAssistance.gov (from FY2001). The newest year is incomplete until agencies finish reporting and is hatched. The top recipient counts countries only.
View as table
| Period | Value |
|---|---|
| FY2009 | $44.7B |
| FY2010 | $42B |
| FY2011 | $47.4B |
| FY2012 | $46.2B |
| FY2013 | $46.1B |
| FY2014 | $41.8B |
| FY2015 | $48.4B |
| FY2016 | $46.8B |
Security and energy
Troops abroad
Troops stationed abroad numbered 346k in September 2009 and 194k in September 2016. Japan hosted the most in 4 of those years.
Active-duty troops abroad
Data notes
Active-duty U.S. military personnel stationed outside the United States and its territories (afloat and unassigned included where the source reports them), one snapshot a year (September; June for 1953–56), from the Defense Manpower Data Center’s tables and, for years it did not publish, troopdata. The year in progress shows its latest quarter, hatched. From December 2017 DMDC counts permanent assignments only, so later figures leave out most deployed forces.
View as table
| Period | Value |
|---|---|
| Sep 2009 | 346,277 |
| Sep 2010 | 333,240 |
| Sep 2011 | 330,458 |
| Sep 2012 | 266,385 |
| Sep 2013 | 245,561 |
| Sep 2014 | 225,753 |
| Sep 2015 | 205,770 |
| Sep 2016 | 194,431 |
Strategic Petroleum Reserve
The reserve held 703M bbl on Jan 23, 2009 and 695M bbl on Jan 20, 2017, with a high of 727M bbl on Jan 1, 2010.
Reserve level, million barrels
Data notes
Crude oil held in the Strategic Petroleum Reserve at the end of each week, in millions of barrels, from the Energy Information Administration (from August 1982). Sales, exchanges and refills are authorized by Congress and the executive branch at different times, and many take months to carry out. The Energy page marks each action.
View as table
| Period | Value |
|---|---|
| Jan 23, 2009 | 703M bbl |
| Jan 30, 2009 | 704M bbl |
| Feb 6, 2009 | 704M bbl |
| Feb 13, 2009 | 704M bbl |
| Feb 20, 2009 | 704M bbl |
| Feb 27, 2009 | 705M bbl |
| Mar 6, 2009 | 706M bbl |
| Mar 13, 2009 | 707M bbl |
| Mar 20, 2009 | 709M bbl |
| Mar 27, 2009 | 711M bbl |
| Apr 3, 2009 | 713M bbl |
| Apr 10, 2009 | 714M bbl |
| Apr 17, 2009 | 715M bbl |
| Apr 24, 2009 | 717M bbl |
| May 1, 2009 | 719M bbl |
| May 8, 2009 | 720M bbl |
| May 15, 2009 | 720M bbl |
| May 22, 2009 | 722M bbl |
| May 29, 2009 | 722M bbl |
| Jun 5, 2009 | 722M bbl |
| Jun 12, 2009 | 722M bbl |
| Jun 19, 2009 | 723M bbl |
| Jun 26, 2009 | 723M bbl |
| Jul 3, 2009 | 723M bbl |
| Jul 10, 2009 | 724M bbl |
| Jul 17, 2009 | 724M bbl |
| Jul 24, 2009 | 724M bbl |
| Jul 31, 2009 | 724M bbl |
| Aug 7, 2009 | 724M bbl |
| Aug 14, 2009 | 724M bbl |
| Aug 21, 2009 | 724M bbl |
| Aug 28, 2009 | 724M bbl |
| Sep 4, 2009 | 724M bbl |
| Sep 11, 2009 | 725M bbl |
| Sep 18, 2009 | 725M bbl |
| Sep 25, 2009 | 725M bbl |
| Oct 2, 2009 | 725M bbl |
| Oct 9, 2009 | 725M bbl |
| Oct 16, 2009 | 725M bbl |
| Oct 23, 2009 | 725M bbl |
| Oct 30, 2009 | 725M bbl |
| Nov 6, 2009 | 725M bbl |
| Nov 13, 2009 | 725M bbl |
| Nov 20, 2009 | 725M bbl |
| Nov 27, 2009 | 726M bbl |
| Dec 4, 2009 | 726M bbl |
| Dec 11, 2009 | 726M bbl |
| Dec 18, 2009 | 726M bbl |
| Dec 25, 2009 | 726M bbl |
| Jan 1, 2010 | 727M bbl |
| Jan 8, 2010 | 727M bbl |
| Jan 15, 2010 | 727M bbl |
| Jan 22, 2010 | 727M bbl |
| Jan 29, 2010 | 727M bbl |
| Feb 5, 2010 | 727M bbl |
| Feb 12, 2010 | 727M bbl |
| Feb 19, 2010 | 727M bbl |
| Feb 26, 2010 | 727M bbl |
| Mar 5, 2010 | 727M bbl |
| Mar 12, 2010 | 727M bbl |
| Mar 19, 2010 | 727M bbl |
| Mar 26, 2010 | 727M bbl |
| Apr 2, 2010 | 727M bbl |
| Apr 9, 2010 | 727M bbl |
| Apr 16, 2010 | 727M bbl |
| Apr 23, 2010 | 727M bbl |
| Apr 30, 2010 | 727M bbl |
| May 7, 2010 | 727M bbl |
| May 14, 2010 | 727M bbl |
| May 21, 2010 | 727M bbl |
| May 28, 2010 | 727M bbl |
| Jun 4, 2010 | 727M bbl |
| Jun 11, 2010 | 727M bbl |
| Jun 18, 2010 | 727M bbl |
| Jun 25, 2010 | 727M bbl |
| Jul 2, 2010 | 727M bbl |
| Jul 9, 2010 | 727M bbl |
| Jul 16, 2010 | 727M bbl |
| Jul 23, 2010 | 727M bbl |
| Jul 30, 2010 | 727M bbl |
| Aug 6, 2010 | 727M bbl |
| Aug 13, 2010 | 727M bbl |
| Aug 20, 2010 | 727M bbl |
| Aug 27, 2010 | 727M bbl |
| Sep 3, 2010 | 727M bbl |
| Sep 10, 2010 | 727M bbl |
| Sep 17, 2010 | 726M bbl |
| Sep 24, 2010 | 726M bbl |
| Oct 1, 2010 | 726M bbl |
| Oct 8, 2010 | 727M bbl |
| Oct 15, 2010 | 727M bbl |
| Oct 22, 2010 | 727M bbl |
| Oct 29, 2010 | 727M bbl |
| Nov 5, 2010 | 727M bbl |
| Nov 12, 2010 | 727M bbl |
| Nov 19, 2010 | 727M bbl |
| Nov 26, 2010 | 727M bbl |
| Dec 3, 2010 | 727M bbl |
| Dec 10, 2010 | 727M bbl |
| Dec 17, 2010 | 727M bbl |
| Dec 24, 2010 | 727M bbl |
| Dec 31, 2010 | 727M bbl |
| Jan 7, 2011 | 727M bbl |
| Jan 14, 2011 | 727M bbl |
| Jan 21, 2011 | 727M bbl |
| Jan 28, 2011 | 727M bbl |
| Feb 4, 2011 | 727M bbl |
| Feb 11, 2011 | 727M bbl |
| Feb 18, 2011 | 727M bbl |
| Feb 25, 2011 | 727M bbl |
| Mar 4, 2011 | 727M bbl |
| Mar 11, 2011 | 727M bbl |
| Mar 18, 2011 | 727M bbl |
| Mar 25, 2011 | 727M bbl |
| Apr 1, 2011 | 727M bbl |
| Apr 8, 2011 | 727M bbl |
| Apr 15, 2011 | 727M bbl |
| Apr 22, 2011 | 727M bbl |
| Apr 29, 2011 | 727M bbl |
| May 6, 2011 | 727M bbl |
| May 13, 2011 | 727M bbl |
| May 20, 2011 | 727M bbl |
| May 27, 2011 | 727M bbl |
| Jun 3, 2011 | 727M bbl |
| Jun 10, 2011 | 727M bbl |
| Jun 17, 2011 | 727M bbl |
| Jun 24, 2011 | 727M bbl |
| Jul 1, 2011 | 727M bbl |
| Jul 8, 2011 | 727M bbl |
| Jul 15, 2011 | 727M bbl |
| Jul 22, 2011 | 724M bbl |
| Jul 29, 2011 | 720M bbl |
| Aug 5, 2011 | 717M bbl |
| Aug 12, 2011 | 711M bbl |
| Aug 19, 2011 | 707M bbl |
| Aug 26, 2011 | 702M bbl |
| Sep 2, 2011 | 697M bbl |
| Sep 9, 2011 | 696M bbl |
| Sep 16, 2011 | 696M bbl |
| Sep 23, 2011 | 696M bbl |
| Sep 30, 2011 | 696M bbl |
| Oct 7, 2011 | 696M bbl |
| Oct 14, 2011 | 696M bbl |
| Oct 21, 2011 | 696M bbl |
| Oct 28, 2011 | 696M bbl |
| Nov 4, 2011 | 696M bbl |
| Nov 11, 2011 | 696M bbl |
| Nov 18, 2011 | 696M bbl |
| Nov 25, 2011 | 696M bbl |
| Dec 2, 2011 | 696M bbl |
| Dec 9, 2011 | 696M bbl |
| Dec 16, 2011 | 696M bbl |
| Dec 23, 2011 | 696M bbl |
| Dec 30, 2011 | 696M bbl |
| Jan 6, 2012 | 696M bbl |
| Jan 13, 2012 | 696M bbl |
| Jan 20, 2012 | 696M bbl |
| Jan 27, 2012 | 696M bbl |
| Feb 3, 2012 | 696M bbl |
| Feb 10, 2012 | 696M bbl |
| Feb 17, 2012 | 696M bbl |
| Feb 24, 2012 | 696M bbl |
| Mar 2, 2012 | 696M bbl |
| Mar 9, 2012 | 696M bbl |
| Mar 16, 2012 | 696M bbl |
| Mar 23, 2012 | 696M bbl |
| Mar 30, 2012 | 696M bbl |
| Apr 6, 2012 | 696M bbl |
| Apr 13, 2012 | 696M bbl |
| Apr 20, 2012 | 696M bbl |
| Apr 27, 2012 | 696M bbl |
| May 4, 2012 | 696M bbl |
| May 11, 2012 | 696M bbl |
| May 18, 2012 | 696M bbl |
| May 25, 2012 | 696M bbl |
| Jun 1, 2012 | 696M bbl |
| Jun 8, 2012 | 696M bbl |
| Jun 15, 2012 | 696M bbl |
| Jun 22, 2012 | 696M bbl |
| Jun 29, 2012 | 696M bbl |
| Jul 6, 2012 | 696M bbl |
| Jul 13, 2012 | 696M bbl |
| Jul 20, 2012 | 696M bbl |
| Jul 27, 2012 | 696M bbl |
| Aug 3, 2012 | 696M bbl |
| Aug 10, 2012 | 696M bbl |
| Aug 17, 2012 | 696M bbl |
| Aug 24, 2012 | 696M bbl |
| Aug 31, 2012 | 696M bbl |
| Sep 7, 2012 | 695M bbl |
| Sep 14, 2012 | 695M bbl |
| Sep 21, 2012 | 695M bbl |
| Sep 28, 2012 | 695M bbl |
| Oct 5, 2012 | 695M bbl |
| Oct 12, 2012 | 695M bbl |
| Oct 19, 2012 | 695M bbl |
| Oct 26, 2012 | 695M bbl |
| Nov 2, 2012 | 695M bbl |
| Nov 9, 2012 | 695M bbl |
| Nov 16, 2012 | 695M bbl |
| Nov 23, 2012 | 695M bbl |
| Nov 30, 2012 | 695M bbl |
| Dec 7, 2012 | 695M bbl |
| Dec 14, 2012 | 695M bbl |
| Dec 21, 2012 | 695M bbl |
| Dec 28, 2012 | 695M bbl |
| Jan 4, 2013 | 695M bbl |
| Jan 11, 2013 | 695M bbl |
| Jan 18, 2013 | 695M bbl |
| Jan 25, 2013 | 695M bbl |
| Feb 1, 2013 | 696M bbl |
| Feb 8, 2013 | 696M bbl |
| Feb 15, 2013 | 696M bbl |
| Feb 22, 2013 | 696M bbl |
| Mar 1, 2013 | 696M bbl |
| Mar 8, 2013 | 696M bbl |
| Mar 15, 2013 | 696M bbl |
| Mar 22, 2013 | 696M bbl |
| Mar 29, 2013 | 696M bbl |
| Apr 5, 2013 | 696M bbl |
| Apr 12, 2013 | 696M bbl |
| Apr 19, 2013 | 696M bbl |
| Apr 26, 2013 | 696M bbl |
| May 3, 2013 | 696M bbl |
| May 10, 2013 | 696M bbl |
| May 17, 2013 | 696M bbl |
| May 24, 2013 | 696M bbl |
| May 31, 2013 | 696M bbl |
| Jun 7, 2013 | 696M bbl |
| Jun 14, 2013 | 696M bbl |
| Jun 21, 2013 | 696M bbl |
| Jun 28, 2013 | 696M bbl |
| Jul 5, 2013 | 696M bbl |
| Jul 12, 2013 | 696M bbl |
| Jul 19, 2013 | 696M bbl |
| Jul 26, 2013 | 696M bbl |
| Aug 2, 2013 | 696M bbl |
| Aug 9, 2013 | 696M bbl |
| Aug 16, 2013 | 696M bbl |
| Aug 23, 2013 | 696M bbl |
| Aug 30, 2013 | 696M bbl |
| Sep 6, 2013 | 696M bbl |
| Sep 13, 2013 | 696M bbl |
| Sep 20, 2013 | 696M bbl |
| Sep 27, 2013 | 696M bbl |
| Oct 4, 2013 | 696M bbl |
| Oct 11, 2013 | 696M bbl |
| Oct 18, 2013 | 696M bbl |
| Oct 25, 2013 | 696M bbl |
| Nov 1, 2013 | 696M bbl |
| Nov 8, 2013 | 696M bbl |
| Nov 15, 2013 | 696M bbl |
| Nov 22, 2013 | 696M bbl |
| Nov 29, 2013 | 696M bbl |
| Dec 6, 2013 | 696M bbl |
| Dec 13, 2013 | 696M bbl |
| Dec 20, 2013 | 696M bbl |
| Dec 27, 2013 | 696M bbl |
| Jan 3, 2014 | 696M bbl |
| Jan 10, 2014 | 696M bbl |
| Jan 17, 2014 | 696M bbl |
| Jan 24, 2014 | 696M bbl |
| Jan 31, 2014 | 696M bbl |
| Feb 7, 2014 | 696M bbl |
| Feb 14, 2014 | 696M bbl |
| Feb 21, 2014 | 696M bbl |
| Feb 28, 2014 | 696M bbl |
| Mar 7, 2014 | 696M bbl |
| Mar 14, 2014 | 696M bbl |
| Mar 21, 2014 | 696M bbl |
| Mar 28, 2014 | 696M bbl |
| Apr 4, 2014 | 696M bbl |
| Apr 11, 2014 | 695M bbl |
| Apr 18, 2014 | 695M bbl |
| Apr 25, 2014 | 694M bbl |
| May 2, 2014 | 693M bbl |
| May 9, 2014 | 692M bbl |
| May 16, 2014 | 691M bbl |
| May 23, 2014 | 691M bbl |
| May 30, 2014 | 691M bbl |
| Jun 6, 2014 | 691M bbl |
| Jun 13, 2014 | 691M bbl |
| Jun 20, 2014 | 691M bbl |
| Jun 27, 2014 | 691M bbl |
| Jul 4, 2014 | 691M bbl |
| Jul 11, 2014 | 691M bbl |
| Jul 18, 2014 | 691M bbl |
| Jul 25, 2014 | 691M bbl |
| Aug 1, 2014 | 691M bbl |
| Aug 8, 2014 | 691M bbl |
| Aug 15, 2014 | 691M bbl |
| Aug 22, 2014 | 691M bbl |
| Aug 29, 2014 | 691M bbl |
| Sep 5, 2014 | 691M bbl |
| Sep 12, 2014 | 691M bbl |
| Sep 19, 2014 | 691M bbl |
| Sep 26, 2014 | 691M bbl |
| Oct 3, 2014 | 691M bbl |
| Oct 10, 2014 | 691M bbl |
| Oct 17, 2014 | 691M bbl |
| Oct 24, 2014 | 691M bbl |
| Oct 31, 2014 | 691M bbl |
| Nov 7, 2014 | 691M bbl |
| Nov 14, 2014 | 691M bbl |
| Nov 21, 2014 | 691M bbl |
| Nov 28, 2014 | 691M bbl |
| Dec 5, 2014 | 691M bbl |
| Dec 12, 2014 | 691M bbl |
| Dec 19, 2014 | 691M bbl |
| Dec 26, 2014 | 691M bbl |
| Jan 2, 2015 | 691M bbl |
| Jan 9, 2015 | 691M bbl |
| Jan 16, 2015 | 691M bbl |
| Jan 23, 2015 | 691M bbl |
| Jan 30, 2015 | 691M bbl |
| Feb 6, 2015 | 691M bbl |
| Feb 13, 2015 | 691M bbl |
| Feb 20, 2015 | 691M bbl |
| Feb 27, 2015 | 691M bbl |
| Mar 6, 2015 | 691M bbl |
| Mar 13, 2015 | 691M bbl |
| Mar 20, 2015 | 691M bbl |
| Mar 27, 2015 | 691M bbl |
| Apr 3, 2015 | 691M bbl |
| Apr 10, 2015 | 691M bbl |
| Apr 17, 2015 | 691M bbl |
| Apr 24, 2015 | 691M bbl |
| May 1, 2015 | 691M bbl |
| May 8, 2015 | 691M bbl |
| May 15, 2015 | 691M bbl |
| May 22, 2015 | 692M bbl |
| May 29, 2015 | 692M bbl |
| Jun 5, 2015 | 692M bbl |
| Jun 12, 2015 | 693M bbl |
| Jun 19, 2015 | 693M bbl |
| Jun 26, 2015 | 694M bbl |
| Jul 3, 2015 | 694M bbl |
| Jul 10, 2015 | 695M bbl |
| Jul 17, 2015 | 695M bbl |
| Jul 24, 2015 | 695M bbl |
| Jul 31, 2015 | 695M bbl |
| Aug 7, 2015 | 695M bbl |
| Aug 14, 2015 | 695M bbl |
| Aug 21, 2015 | 695M bbl |
| Aug 28, 2015 | 695M bbl |
| Sep 4, 2015 | 695M bbl |
| Sep 11, 2015 | 695M bbl |
| Sep 18, 2015 | 695M bbl |
| Sep 25, 2015 | 695M bbl |
| Oct 2, 2015 | 695M bbl |
| Oct 9, 2015 | 695M bbl |
| Oct 16, 2015 | 695M bbl |
| Oct 23, 2015 | 695M bbl |
| Oct 30, 2015 | 695M bbl |
| Nov 6, 2015 | 695M bbl |
| Nov 13, 2015 | 695M bbl |
| Nov 20, 2015 | 695M bbl |
| Nov 27, 2015 | 695M bbl |
| Dec 4, 2015 | 695M bbl |
| Dec 11, 2015 | 695M bbl |
| Dec 18, 2015 | 695M bbl |
| Dec 25, 2015 | 695M bbl |
| Jan 1, 2016 | 695M bbl |
| Jan 8, 2016 | 695M bbl |
| Jan 15, 2016 | 695M bbl |
| Jan 22, 2016 | 695M bbl |
| Jan 29, 2016 | 695M bbl |
| Feb 5, 2016 | 695M bbl |
| Feb 12, 2016 | 695M bbl |
| Feb 19, 2016 | 695M bbl |
| Feb 26, 2016 | 695M bbl |
| Mar 4, 2016 | 695M bbl |
| Mar 11, 2016 | 695M bbl |
| Mar 18, 2016 | 695M bbl |
| Mar 25, 2016 | 695M bbl |
| Apr 1, 2016 | 695M bbl |
| Apr 8, 2016 | 695M bbl |
| Apr 15, 2016 | 695M bbl |
| Apr 22, 2016 | 695M bbl |
| Apr 29, 2016 | 695M bbl |
| May 6, 2016 | 695M bbl |
| May 13, 2016 | 695M bbl |
| May 20, 2016 | 695M bbl |
| May 27, 2016 | 695M bbl |
| Jun 3, 2016 | 695M bbl |
| Jun 10, 2016 | 695M bbl |
| Jun 17, 2016 | 695M bbl |
| Jun 24, 2016 | 695M bbl |
| Jul 1, 2016 | 695M bbl |
| Jul 8, 2016 | 695M bbl |
| Jul 15, 2016 | 695M bbl |
| Jul 22, 2016 | 695M bbl |
| Jul 29, 2016 | 695M bbl |
| Aug 5, 2016 | 695M bbl |
| Aug 12, 2016 | 695M bbl |
| Aug 19, 2016 | 695M bbl |
| Aug 26, 2016 | 695M bbl |
| Sep 2, 2016 | 695M bbl |
| Sep 9, 2016 | 695M bbl |
| Sep 16, 2016 | 695M bbl |
| Sep 23, 2016 | 695M bbl |
| Sep 30, 2016 | 695M bbl |
| Oct 7, 2016 | 695M bbl |
| Oct 14, 2016 | 695M bbl |
| Oct 21, 2016 | 695M bbl |
| Oct 28, 2016 | 695M bbl |
| Nov 4, 2016 | 695M bbl |
| Nov 11, 2016 | 695M bbl |
| Nov 18, 2016 | 695M bbl |
| Nov 25, 2016 | 695M bbl |
| Dec 2, 2016 | 695M bbl |
| Dec 9, 2016 | 695M bbl |
| Dec 16, 2016 | 695M bbl |
| Dec 23, 2016 | 695M bbl |
| Dec 30, 2016 | 695M bbl |
| Jan 6, 2017 | 695M bbl |
| Jan 13, 2017 | 695M bbl |
| Jan 20, 2017 | 695M bbl |
Source: the site’s Presidency, Congress and Supreme Court data, each named in its card’s Data notes; party control of Congress from the House and Senate historians; appointments from the Federal Judicial Center. Portrait: public domain, via Wikimedia Commons. Built October 19, 2026.