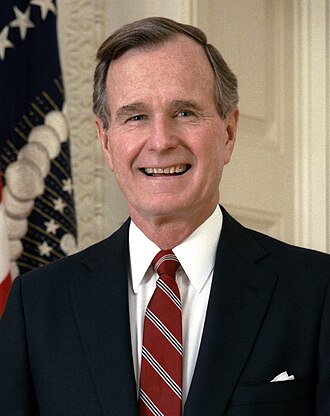
George H. W. Bush
41st president · Republican · January 20, 1989 – January 19, 1993
George Herbert Walker Bush was the 41st president of the United States, serving from 1989 to 1993. A member of the Republican Party, he was the 43rd vice president under President Ronald Reagan. (Wikipedia, CC BY-SA 4.0)
How to read this
Each card takes a series from one of the site’s Presidency, Congress or Supreme Court pages and shows only the time Bush was in office. Monthly figures run from the month of the inauguration to the month the term ended; a fiscal or calendar year counts for the president who held office for most of its days. Cards whose data begins after 1989 say where it starts, and a card with no data for the term is left out.
These are conditions during a presidency, not a scorecard. Congress, the courts, the Federal Reserve, the business cycle and events abroad move every one of these numbers, and many policies take effect years after they are signed, so a change during a term is not a measure of what the president caused.
Who held power
Party control of Congress
Republicans held neither chamber of Congress during the time in office.
- 103rd Congress1993House: Dem.258 D · 176 R · 1 otherSenate: Dem.57 D · 43 R
- 102nd Congress1991–1993House: Dem.267 D · 167 R · 1 otherSenate: Dem.56 D · 44 R
- 101st Congress1989–1991House: Dem.260 D · 175 RSenate: Dem.55 D · 45 R
Seats are at the start of each Congress. Democrats and Republicans include the independents who caucused with them.
Data notes
Supreme Court appointments
George H. W. Bush appointed 2 justices: Souter (1990) and Thomas (1991).
 Clarence Thomas · Associate justiceNominated Jul 8, 1991 · confirmed 52–48
 David Souter · Associate justiceNominated Jul 25, 1990 · confirmed 90–9
Data notes
A justice counts for the president who nominated them (a recess appointment from the day it began, if earlier). An associate justice later made chief by another president, like William Rehnquist, counts as an elevation for the second. Failed and withdrawn nominations are not listed. Dates and Senate votes from the Federal Judicial Center.
Laws and orders
Laws signed
Signed 1,241 laws, 14 of them major laws. Congress enacted 1 more over a veto.
Laws signed per year in office
By policy area
- Commemorations433 (35%)
- Land, water & farming217 (17%)
- Government, justice & rights157 (13%)
- Economy, taxes & trade138 (11%)
- Health, education & culture112 (9%)
- Defense & foreign affairs102 (8%)
- Transport, housing & emergencies43 (3%)
- Energy & environment39 (3%)
Data notes
Public laws whose enactment date falls in the term, from Congress.gov (93rd Congress, 1973, on; private laws left out), counted through 2026-10-15. A law enacted over a veto is not counted as signed; a bill that became law without a signature is. A bar is one year in office, from the inauguration to the day before its anniversary. Policy areas are the Congressional Research Service’s, grouped as on the Laws page.
View as table
| Period | Value |
|---|---|
| 1989–90 | 240 |
| 1990–91 | 411 |
| 1991–92 | 242 |
| 1992–93 | 348 |
Major laws signed
14 of the laws Bush signed are counted as important enactments, newest first, with how each passed the House and Senate.
- Oct 30, 1992Reclamation Projects Authorization and Adjustment Act of 1992Land, water & farmingRevises existing law to require as a principal modification to the Buffalo Bill Dam and Reservoir, Wyoming, the construction of power generating facilities with a total installed capacity of 25.5 megawatts.HouseVoice voteSenate83–8 (83 yea, 8 nay)
- Oct 24, 1992FREEDOM Support ActDefense & foreign affairsDirects the President to designate a coordinator within the Department of State to be responsible for coordinating assistance to the independent states of the former Soviet Union (excluding Estonia, Latvia, and Lithuania).House232–164 (232 yea, 164 nay)SenateVoice vote
- Oct 24, 1992Energy Policy Act of 1992Energy & environmentHouse363–60 (363 yea, 60 nay)SenateVoice vote
- Dec 18, 1991Intermodal Surface Transportation Efficiency Act of 1991Transport, housing & emergenciesDeclares that it is U.S. policy to develop a national intermodal transportation (IT) system that is economically efficient, is environmentally sound, provides the foundation for the nation to compete in the global economy, and will move people and goods in an energy efficient manner.House372–47 (372 yea, 47 nay)Senate79–8 (79 yea, 8 nay)
- Nov 21, 1991Civil Rights Act of 1991Government, justice & rightsHouse381–38 (381 yea, 38 nay)Senate93–5 (93 yea, 5 nay)
- Jan 14, 1991Authorization for Use of Military Force Against Iraq ResolutionDefense & foreign affairsHouse250–183 (250 yea, 183 nay)SenateUnanimous consent
- Nov 29, 1990Immigration Act of 1990Government, justice & rightsAmends the Immigration and Nationality Act (the Act) to set a permanent annual worldwide level of immigration, to begin in FY 1995, with a transition level for FY 1992 through 1994.House264–118 (264 yea, 118 nay)Senate89–8 (89 yea, 8 nay)
- Nov 28, 1990Cranston-Gonzalez National Affordable Housing ActTransport, housing & emergenciesAffirms the national goal that every American family should be able to afford a decent home in a suitable environment.HouseVoice voteSenate93–6 (93 yea, 6 nay)
- Nov 28, 1990Food, Agriculture, Conservation, and Trade Act of 1990Land, water & farmingAmends the Agricultural Act of 1949 to set forth the dairy program for 1991 through 1995, including milk price supports.House318–102 (318 yea, 102 nay)Senate60–36 (60 yea, 36 nay)
- Nov 15, 1990Clean Air Act Amendments of 1990Energy & environmentHouse401–25 (401 yea, 25 nay)Senate89–10 (89 yea, 10 nay)
- Nov 5, 1990Omnibus Budget Reconciliation Act of 1990Economy, taxes & tradeAmends the Agricultural Act of 1949, as amended by the Food, Agriculture, Conservation, and Trade Act of 1990, to reduce wheat, feed grain, upland cotton, and rice base acreages eligible for deficiency payments from 100 percent to 85 percent.House228–200 (228 yea, 200 nay)Senate54–45 (54 yea, 45 nay)
- Jul 26, 1990Americans with Disabilities Act of 1990Government, justice & rightsHouse377–28 (377 yea, 28 nay)Senate91–6 (91 yea, 6 nay)
- Nov 17, 1989Fair Labor Standards Amendments of 1989Economy, taxes & tradeAmends the Fair Labor Standards Act of 1938 (the Act) to increase the minimum wage per hour from $3.35 in 1989 to: (1) $3.80 beginning April 1, 1990; and (2) $4.25 beginning April 1, 1991, and thereafter.House382–37 (382 yea, 37 nay)Senate89–8 (89 yea, 8 nay)
- Aug 9, 1989Financial Institutions Reform, Recovery, and Enforcement Act of 1989Economy, taxes & tradeSpecifies the purposes of this Act, including regulatory reform, the establishment of an independent insurance agency to provide deposit insurance, and the provision of improved supervision and enhanced enforcement powers.House201–175 (201 yea, 175 nay)SenateMethod not stated
Data notes
Laws counted as important enactments, the same list the Laws page uses for its “Major law” badge, which explains where it comes from. The list does not yet cover a Congress still in session. Each summary is the first sentence of the Congressional Research Service summary, where one stands alone; votes are each chamber’s final-passage tally, or how it passed without a recorded vote.
Economy
Misery index
The misery index (unemployment plus inflation) was 9.9 in January 1989 and 10.6 in January 1993, with a high of 12.6 in December 1990.
Misery index
Unemployment and inflation
Data notes
The misery index adds the unemployment rate to inflation (consumer prices, change from a year earlier) for the same month. Unemployment is the BLS rate, seasonally adjusted, from 1948; inflation is from the consumer price index, from 1948. The first reading is the month the president took office, the last the month the term ended. Both are national averages and are revised.
View as table
| Period | Value |
|---|---|
| Jan 1989 | 9.9 |
| Feb 1989 | 9.8 |
| Mar 1989 | 9.9 |
| Apr 1989 | 10.2 |
| May 1989 | 10.5 |
| Jun 1989 | 10.5 |
| Jul 1989 | 10.3 |
| Aug 1989 | 9.8 |
| Sep 1989 | 9.7 |
| Oct 1989 | 9.9 |
| Nov 1989 | 10.1 |
| Dec 1989 | 10 |
| Jan 1990 | 10.6 |
| Feb 1990 | 10.6 |
| Mar 1990 | 10.4 |
| Apr 1990 | 10.1 |
| May 1990 | 9.8 |
| Jun 1990 | 9.9 |
| Jul 1990 | 10.3 |
| Aug 1990 | 11.4 |
| Sep 1990 | 12.1 |
| Oct 1990 | 12.3 |
| Nov 1990 | 12.4 |
| Dec 1990 | 12.6 |
| Jan 1991 | 12 |
| Feb 1991 | 11.9 |
| Mar 1991 | 11.6 |
| Apr 1991 | 11.5 |
| May 1991 | 11.9 |
| Jun 1991 | 11.6 |
| Jul 1991 | 11.2 |
| Aug 1991 | 10.7 |
| Sep 1991 | 10.3 |
| Oct 1991 | 9.8 |
| Nov 1991 | 10.1 |
| Dec 1991 | 10.3 |
| Jan 1992 | 10 |
| Feb 1992 | 10.2 |
| Mar 1992 | 10.6 |
| Apr 1992 | 10.6 |
| May 1992 | 10.6 |
| Jun 1992 | 10.8 |
| Jul 1992 | 10.9 |
| Aug 1992 | 10.7 |
| Sep 1992 | 10.6 |
| Oct 1992 | 10.6 |
| Nov 1992 | 10.5 |
| Dec 1992 | 10.4 |
| Jan 1993 | 10.6 |
| Period | Unemployment rate | Inflation |
|---|---|---|
| Jan 1989 | 5.4% | 4.5% |
| Feb 1989 | 5.2% | 4.6% |
| Mar 1989 | 5% | 4.9% |
| Apr 1989 | 5.2% | 5% |
| May 1989 | 5.2% | 5.3% |
| Jun 1989 | 5.3% | 5.2% |
| Jul 1989 | 5.2% | 5.1% |
| Aug 1989 | 5.2% | 4.6% |
| Sep 1989 | 5.3% | 4.4% |
| Oct 1989 | 5.3% | 4.6% |
| Nov 1989 | 5.4% | 4.7% |
| Dec 1989 | 5.4% | 4.6% |
| Jan 1990 | 5.4% | 5.2% |
| Feb 1990 | 5.3% | 5.3% |
| Mar 1990 | 5.2% | 5.2% |
| Apr 1990 | 5.4% | 4.7% |
| May 1990 | 5.4% | 4.4% |
| Jun 1990 | 5.2% | 4.7% |
| Jul 1990 | 5.5% | 4.8% |
| Aug 1990 | 5.7% | 5.7% |
| Sep 1990 | 5.9% | 6.2% |
| Oct 1990 | 5.9% | 6.4% |
| Nov 1990 | 6.2% | 6.2% |
| Dec 1990 | 6.3% | 6.3% |
| Jan 1991 | 6.4% | 5.6% |
| Feb 1991 | 6.6% | 5.3% |
| Mar 1991 | 6.8% | 4.8% |
| Apr 1991 | 6.7% | 4.8% |
| May 1991 | 6.9% | 5% |
| Jun 1991 | 6.9% | 4.7% |
| Jul 1991 | 6.8% | 4.4% |
| Aug 1991 | 6.9% | 3.8% |
| Sep 1991 | 6.9% | 3.4% |
| Oct 1991 | 7% | 2.8% |
| Nov 1991 | 7% | 3.1% |
| Dec 1991 | 7.3% | 3% |
| Jan 1992 | 7.3% | 2.7% |
| Feb 1992 | 7.4% | 2.8% |
| Mar 1992 | 7.4% | 3.2% |
| Apr 1992 | 7.4% | 3.2% |
| May 1992 | 7.6% | 3% |
| Jun 1992 | 7.8% | 3% |
| Jul 1992 | 7.7% | 3.2% |
| Aug 1992 | 7.6% | 3.1% |
| Sep 1992 | 7.6% | 3% |
| Oct 1992 | 7.3% | 3.3% |
| Nov 1992 | 7.4% | 3.1% |
| Dec 1992 | 7.4% | 3% |
| Jan 1993 | 7.3% | 3.3% |
Federal deficit and debt
The federal budget balance, as a share of GDP, was −2.7% in FY1989 and −4.5% in FY1992.
Budget balance, % of GDP
Public debt, % of GDP
Data notes
The budget balance is the federal surplus (above zero) or deficit (below) as a share of GDP, by fiscal year (July to June through 1976, October to September since); a year counts for the president in office for most of it, though its budget was usually passed the year before. Debt is total public debt as a share of GDP, quarterly from 1966, including debt the government holds in its own trust funds.
View as table
| Period | Value |
|---|---|
| FY1989 | −2.7% |
| FY1990 | −3.7% |
| FY1991 | −4.4% |
| FY1992 | −4.5% |
| Period | Value |
|---|---|
| Q1 1989 | 49.7% |
| Q2 1989 | 49.9% |
| Q3 1989 | 50.2% |
| Q4 1989 | 51.4% |
| Q1 1990 | 52% |
| Q2 1990 | 52.7% |
| Q3 1990 | 53.8% |
| Q4 1990 | 56% |
| Q1 1991 | 57.4% |
| Q2 1991 | 57.7% |
| Q3 1991 | 59.1% |
| Q4 1991 | 60.7% |
| Q1 1992 | 61% |
| Q2 1992 | 61.6% |
| Q3 1992 | 61.9% |
| Q4 1992 | 62.5% |
| Q1 1993 | 62.9% |
Immigration
Green cards and refugees
New green cards numbered 1.09M in FY1989 and 973k in FY1992, with a high of 1.83M in FY1991.
Green cards
Refugee admissions
Data notes
Green cards are people who became lawful permanent residents in the fiscal year, from the DHS Yearbook of Immigration Statistics (from FY1977). Refugee admissions are from the State Department’s Refugee Processing Center (from FY1980). A fiscal year counts for the administration in office for most of its days; a hatched bar is preliminary.
View as table
| Period | Value |
|---|---|
| FY1989 | 1,090,170 |
| FY1990 | 1,535,870 |
| FY1991 | 1,826,600 |
| FY1992 | 973,450 |
| Period | Value |
|---|---|
| FY1989 | 107,070 |
| FY1990 | 122,066 |
| FY1991 | 113,389 |
| FY1992 | 132,531 |
Removals and border encounters
Removals numbered 34k in FY1989 and 44k in FY1992, with a low of 30k in FY1990.
Removals
Border encounters
Data notes
Removals are formal deportations: the Immigration and Naturalization Service’s through FY2002 (DHS Yearbook) and ICE’s own count from FY2003 (ICE); the two are not the same measure. Border encounters are Border Patrol apprehensions, plus port-of-entry inadmissibles from FY2004 and Title 42 expulsions in FY2020–23 (CBP); they count events, not people. A hatched bar is preliminary.
View as table
| Period | Value |
|---|---|
| FY1989 | 34,430 |
| FY1990 | 30,040 |
| FY1991 | 33,190 |
| FY1992 | 43,670 |
| Period | Value |
|---|---|
| FY1989 | 891,147 |
| FY1990 | 1,103,353 |
| FY1991 | 1,132,033 |
| FY1992 | 1,199,560 |
The U.S. and the world
Goods trade balance
The monthly goods trade balance was −$7B in January 1991 and −$7.9B in January 1993, with a high of −$3.7B in February 1992.
Goods balance, $B a month
Data starts January 1991
Data notes
The goods trade balance is exports minus imports of goods, in billions of dollars a month, seasonally adjusted, on the Census basis, from 1991 (Census Bureau). Below zero the U.S. imported more goods than it exported. Services are not included. Dollars are not adjusted for inflation, so later years run larger.
View as table
| Period | Value |
|---|---|
| Jan 1991 | −$7B |
| Feb 1991 | −$5.8B |
| Mar 1991 | −$4.5B |
| Apr 1991 | −$4.5B |
| May 1991 | −$5.1B |
| Jun 1991 | −$4.9B |
| Jul 1991 | −$5.5B |
| Aug 1991 | −$6B |
| Sep 1991 | −$6.3B |
| Oct 1991 | −$5.8B |
| Nov 1991 | −$4.6B |
| Dec 1991 | −$6.2B |
| Jan 1992 | −$6.4B |
| Feb 1992 | −$3.7B |
| Mar 1992 | −$5.5B |
| Apr 1992 | −$6.8B |
| May 1992 | −$7.9B |
| Jun 1992 | −$6.6B |
| Jul 1992 | −$7.5B |
| Aug 1992 | −$9B |
| Sep 1992 | −$8.2B |
| Oct 1992 | −$7.2B |
| Nov 1992 | −$8.2B |
| Dec 1992 | −$7.4B |
| Jan 1993 | −$7.9B |
Security and energy
Troops abroad
Troops stationed abroad numbered 453k in September 1989 and 295k in September 1992. Germany hosted the most in 4 of those years.
Active-duty troops abroad
Data notes
Active-duty U.S. military personnel stationed outside the United States and its territories (afloat and unassigned included where the source reports them), one snapshot a year (September; June for 1953–56), from the Defense Manpower Data Center’s tables and, for years it did not publish, troopdata. The year in progress shows its latest quarter, hatched. From December 2017 DMDC counts permanent assignments only, so later figures leave out most deployed forces.
View as table
| Period | Value |
|---|---|
| Sep 1989 | 452,930 |
| Sep 1990 | 446,827 |
| Sep 1991 | 393,450 |
| Sep 1992 | 295,379 |
Strategic Petroleum Reserve
The reserve held 561M bbl on Jan 20, 1989 and 575M bbl on Jan 22, 1993, with a high of 590M bbl on Aug 31, 1990.
Reserve level, million barrels
Data notes
Crude oil held in the Strategic Petroleum Reserve at the end of each week, in millions of barrels, from the Energy Information Administration (from August 1982). Sales, exchanges and refills are authorized by Congress and the executive branch at different times, and many take months to carry out. The Energy page marks each action.
View as table
| Period | Value |
|---|---|
| Jan 20, 1989 | 561M bbl |
| Jan 27, 1989 | 561M bbl |
| Feb 3, 1989 | 562M bbl |
| Feb 10, 1989 | 563M bbl |
| Feb 17, 1989 | 563M bbl |
| Feb 24, 1989 | 563M bbl |
| Mar 3, 1989 | 564M bbl |
| Mar 10, 1989 | 564M bbl |
| Mar 17, 1989 | 566M bbl |
| Mar 24, 1989 | 566M bbl |
| Mar 31, 1989 | 566M bbl |
| Apr 7, 1989 | 566M bbl |
| Apr 14, 1989 | 567M bbl |
| Apr 21, 1989 | 567M bbl |
| Apr 28, 1989 | 567M bbl |
| May 5, 1989 | 568M bbl |
| May 12, 1989 | 569M bbl |
| May 19, 1989 | 569M bbl |
| May 26, 1989 | 569M bbl |
| Jun 2, 1989 | 570M bbl |
| Jun 9, 1989 | 571M bbl |
| Jun 16, 1989 | 571M bbl |
| Jun 23, 1989 | 571M bbl |
| Jun 30, 1989 | 572M bbl |
| Jul 7, 1989 | 572M bbl |
| Jul 14, 1989 | 573M bbl |
| Jul 21, 1989 | 573M bbl |
| Jul 28, 1989 | 574M bbl |
| Aug 4, 1989 | 574M bbl |
| Aug 11, 1989 | 574M bbl |
| Aug 18, 1989 | 574M bbl |
| Aug 25, 1989 | 575M bbl |
| Sep 1, 1989 | 575M bbl |
| Sep 8, 1989 | 576M bbl |
| Sep 15, 1989 | 576M bbl |
| Sep 22, 1989 | 577M bbl |
| Sep 29, 1989 | 577M bbl |
| Oct 6, 1989 | 577M bbl |
| Oct 13, 1989 | 577M bbl |
| Oct 20, 1989 | 578M bbl |
| Oct 27, 1989 | 578M bbl |
| Nov 3, 1989 | 578M bbl |
| Nov 10, 1989 | 579M bbl |
| Nov 17, 1989 | 579M bbl |
| Nov 24, 1989 | 579M bbl |
| Dec 1, 1989 | 579M bbl |
| Dec 8, 1989 | 580M bbl |
| Dec 15, 1989 | 580M bbl |
| Dec 22, 1989 | 580M bbl |
| Dec 29, 1989 | 580M bbl |
| Jan 5, 1990 | 580M bbl |
| Jan 12, 1990 | 580M bbl |
| Jan 19, 1990 | 580M bbl |
| Jan 26, 1990 | 580M bbl |
| Feb 2, 1990 | 581M bbl |
| Feb 9, 1990 | 581M bbl |
| Feb 16, 1990 | 581M bbl |
| Feb 23, 1990 | 581M bbl |
| Mar 2, 1990 | 581M bbl |
| Mar 9, 1990 | 581M bbl |
| Mar 16, 1990 | 581M bbl |
| Mar 23, 1990 | 581M bbl |
| Mar 30, 1990 | 581M bbl |
| Apr 6, 1990 | 582M bbl |
| Apr 13, 1990 | 582M bbl |
| Apr 20, 1990 | 582M bbl |
| Apr 27, 1990 | 583M bbl |
| May 4, 1990 | 583M bbl |
| May 11, 1990 | 584M bbl |
| May 18, 1990 | 585M bbl |
| May 25, 1990 | 586M bbl |
| Jun 1, 1990 | 586M bbl |
| Jun 8, 1990 | 586M bbl |
| Jun 15, 1990 | 586M bbl |
| Jun 22, 1990 | 586M bbl |
| Jun 29, 1990 | 587M bbl |
| Jul 6, 1990 | 587M bbl |
| Jul 13, 1990 | 587M bbl |
| Jul 20, 1990 | 587M bbl |
| Jul 27, 1990 | 587M bbl |
| Aug 3, 1990 | 587M bbl |
| Aug 10, 1990 | 587M bbl |
| Aug 17, 1990 | 587M bbl |
| Aug 24, 1990 | 589M bbl |
| Aug 31, 1990 | 590M bbl |
| Sep 7, 1990 | 590M bbl |
| Sep 14, 1990 | 590M bbl |
| Sep 21, 1990 | 590M bbl |
| Sep 28, 1990 | 590M bbl |
| Oct 5, 1990 | 590M bbl |
| Oct 12, 1990 | 590M bbl |
| Oct 19, 1990 | 590M bbl |
| Oct 26, 1990 | 590M bbl |
| Nov 2, 1990 | 589M bbl |
| Nov 9, 1990 | 588M bbl |
| Nov 16, 1990 | 588M bbl |
| Nov 23, 1990 | 587M bbl |
| Nov 30, 1990 | 587M bbl |
| Dec 7, 1990 | 586M bbl |
| Dec 14, 1990 | 586M bbl |
| Dec 21, 1990 | 586M bbl |
| Dec 28, 1990 | 586M bbl |
| Jan 4, 1991 | 586M bbl |
| Jan 11, 1991 | 586M bbl |
| Jan 18, 1991 | 586M bbl |
| Jan 25, 1991 | 586M bbl |
| Feb 1, 1991 | 586M bbl |
| Feb 8, 1991 | 585M bbl |
| Feb 15, 1991 | 584M bbl |
| Feb 22, 1991 | 583M bbl |
| Mar 1, 1991 | 582M bbl |
| Mar 8, 1991 | 578M bbl |
| Mar 15, 1991 | 575M bbl |
| Mar 22, 1991 | 572M bbl |
| Mar 29, 1991 | 571M bbl |
| Apr 5, 1991 | 568M bbl |
| Apr 12, 1991 | 568M bbl |
| Apr 19, 1991 | 568M bbl |
| Apr 26, 1991 | 568M bbl |
| May 3, 1991 | 568M bbl |
| May 10, 1991 | 568M bbl |
| May 17, 1991 | 568M bbl |
| May 24, 1991 | 568M bbl |
| May 31, 1991 | 568M bbl |
| Jun 7, 1991 | 568M bbl |
| Jun 14, 1991 | 568M bbl |
| Jun 21, 1991 | 568M bbl |
| Jun 28, 1991 | 568M bbl |
| Jul 5, 1991 | 568M bbl |
| Jul 12, 1991 | 568M bbl |
| Jul 19, 1991 | 568M bbl |
| Jul 26, 1991 | 568M bbl |
| Aug 2, 1991 | 568M bbl |
| Aug 9, 1991 | 568M bbl |
| Aug 16, 1991 | 569M bbl |
| Aug 23, 1991 | 569M bbl |
| Aug 30, 1991 | 569M bbl |
| Sep 6, 1991 | 569M bbl |
| Sep 13, 1991 | 569M bbl |
| Sep 20, 1991 | 569M bbl |
| Sep 27, 1991 | 569M bbl |
| Oct 4, 1991 | 569M bbl |
| Oct 11, 1991 | 569M bbl |
| Oct 18, 1991 | 569M bbl |
| Oct 25, 1991 | 569M bbl |
| Nov 1, 1991 | 569M bbl |
| Nov 8, 1991 | 569M bbl |
| Nov 15, 1991 | 569M bbl |
| Nov 22, 1991 | 569M bbl |
| Nov 29, 1991 | 569M bbl |
| Dec 6, 1991 | 569M bbl |
| Dec 13, 1991 | 569M bbl |
| Dec 20, 1991 | 569M bbl |
| Dec 27, 1991 | 569M bbl |
| Jan 3, 1992 | 569M bbl |
| Jan 10, 1992 | 569M bbl |
| Jan 17, 1992 | 569M bbl |
| Jan 24, 1992 | 569M bbl |
| Jan 31, 1992 | 569M bbl |
| Feb 7, 1992 | 569M bbl |
| Feb 14, 1992 | 569M bbl |
| Feb 21, 1992 | 569M bbl |
| Feb 28, 1992 | 569M bbl |
| Mar 6, 1992 | 569M bbl |
| Mar 13, 1992 | 569M bbl |
| Mar 20, 1992 | 569M bbl |
| Mar 27, 1992 | 569M bbl |
| Apr 3, 1992 | 569M bbl |
| Apr 10, 1992 | 569M bbl |
| Apr 17, 1992 | 569M bbl |
| Apr 24, 1992 | 569M bbl |
| May 1, 1992 | 569M bbl |
| May 8, 1992 | 569M bbl |
| May 15, 1992 | 569M bbl |
| May 22, 1992 | 569M bbl |
| May 29, 1992 | 569M bbl |
| Jun 5, 1992 | 569M bbl |
| Jun 12, 1992 | 569M bbl |
| Jun 19, 1992 | 569M bbl |
| Jun 26, 1992 | 570M bbl |
| Jul 3, 1992 | 570M bbl |
| Jul 10, 1992 | 570M bbl |
| Jul 17, 1992 | 570M bbl |
| Jul 24, 1992 | 570M bbl |
| Jul 31, 1992 | 570M bbl |
| Aug 7, 1992 | 570M bbl |
| Aug 14, 1992 | 570M bbl |
| Aug 21, 1992 | 570M bbl |
| Aug 28, 1992 | 570M bbl |
| Sep 4, 1992 | 570M bbl |
| Sep 11, 1992 | 570M bbl |
| Sep 18, 1992 | 570M bbl |
| Sep 25, 1992 | 570M bbl |
| Oct 2, 1992 | 571M bbl |
| Oct 9, 1992 | 571M bbl |
| Oct 16, 1992 | 573M bbl |
| Oct 23, 1992 | 573M bbl |
| Oct 30, 1992 | 574M bbl |
| Nov 6, 1992 | 574M bbl |
| Nov 13, 1992 | 574M bbl |
| Nov 20, 1992 | 574M bbl |
| Nov 27, 1992 | 574M bbl |
| Dec 4, 1992 | 574M bbl |
| Dec 11, 1992 | 574M bbl |
| Dec 18, 1992 | 574M bbl |
| Dec 25, 1992 | 575M bbl |
| Jan 1, 1993 | 575M bbl |
| Jan 8, 1993 | 575M bbl |
| Jan 15, 1993 | 575M bbl |
| Jan 22, 1993 | 575M bbl |
Source: the site’s Presidency, Congress and Supreme Court data, each named in its card’s Data notes; party control of Congress from the House and Senate historians; appointments from the Federal Judicial Center. Portrait: public domain, via Wikimedia Commons. Built October 19, 2026.