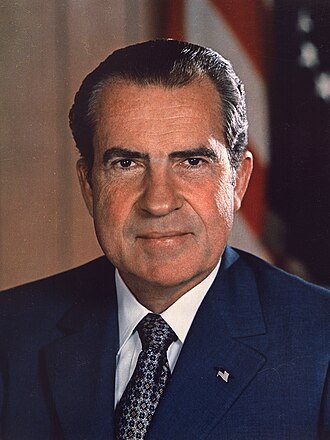
Richard Nixon
37th president · Republican · January 20, 1969 – August 8, 1974
Richard Milhous Nixon was the 37th president of the United States, serving from 1969 until his resignation in 1974. A member of the Republican Party, he represented California in both houses of the United States Congress before serving as the 36th vice president under President Dwight D. Eisenhower from 1953 to 1961. (Wikipedia, CC BY-SA 4.0)
How to read this
Each card takes a series from one of the site’s Presidency, Congress or Supreme Court pages and shows only the time Nixon was in office. Monthly figures run from the month of the inauguration to the month the term ended; a fiscal or calendar year counts for the president who held office for most of its days. Cards whose data begins after 1969 say where it starts, and a card with no data for the term is left out.
These are conditions during a presidency, not a scorecard. Congress, the courts, the Federal Reserve, the business cycle and events abroad move every one of these numbers, and many policies take effect years after they are signed, so a change during a term is not a measure of what the president caused.
Who held power
Party control of Congress
Republicans held neither chamber of Congress during the time in office.
- 93rd Congress1973–1974House: Dem.243 D · 192 RSenate: Dem.57 D · 43 R
- 92nd Congress1971–1973House: Dem.255 D · 180 RSenate: Dem.55 D · 45 R
- 91st Congress1969–1971House: Dem.243 D · 192 RSenate: Dem.57 D · 43 R
Seats are at the start of each Congress. Democrats and Republicans include the independents who caucused with them.
Data notes
Supreme Court appointments
Richard Nixon appointed 4 justices: Burger (1969), Blackmun (1970), Rehnquist (1971) and Powell (1971).
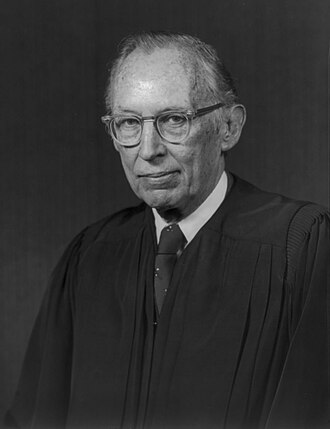 Lewis Powell · Associate justiceNominated Oct 22, 1971 · confirmed 89–1
 William Rehnquist · Associate justiceNominated Oct 22, 1971 · confirmed 68–26
 Harry Blackmun · Associate justiceNominated Apr 15, 1970 · confirmed 94–0
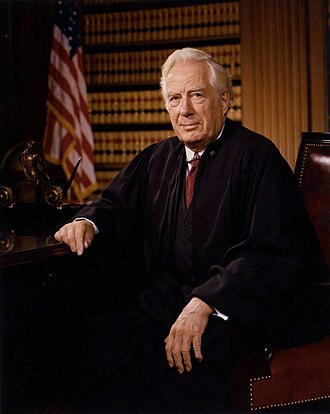 Warren Burger · Chief justiceNominated May 23, 1969 · confirmed 74–3
Data notes
A justice counts for the president who nominated them (a recess appointment from the day it began, if earlier). An associate justice later made chief by another president, like William Rehnquist, counts as an elevation for the second. Failed and withdrawn nominations are not listed. Dates and Senate votes from the Federal Judicial Center.
Laws and orders
Laws signed
Signed 368 laws, 12 of them major laws. Congress enacted 1 more over a veto.
Laws signed per year in office
Data starts January 1973
By policy area
- Economy, taxes & trade72 (20%)
- Government, justice & rights61 (17%)
- Defense & foreign affairs58 (16%)
- Land, water & farming47 (13%)
- Health, education & culture40 (11%)
- Commemorations39 (11%)
- Transport, housing & emergencies32 (9%)
- Energy & environment19 (5%)
Data notes
Public laws whose enactment date falls in the term, from Congress.gov (93rd Congress, 1973, on; private laws left out), counted through 2026-10-15. A law enacted over a veto is not counted as signed; a bill that became law without a signature is. A bar is one year in office, from the inauguration to the day before its anniversary. Policy areas are the Congressional Research Service’s, grouped as on the Laws page.
View as table
| Period | Value |
|---|---|
| 1969–70 | 0 |
| 1970–71 | 0 |
| 1971–72 | 0 |
| 1972–73 | 1 |
| 1973–74 | 244 |
| 1974 | 123 |
Major laws signed
12 of the laws Nixon signed are counted as important enactments, newest first, with how each passed the House and Senate.
- Jul 12, 1974Congressional Budget and Impoundment Control Act of 1974Economy, taxes & tradeHouse401–6 (401 yea, 6 nay)Senate75–0 (75 yea, 0 nay)
- Apr 8, 1974Fair Labor Standards Amendments of 1974Economy, taxes & tradeProvides for an increase in the minimum wage to $2.30 an hour over a specified period for employees covered before 1966, nonagricultural employees covered in 1966 and 1974, and agricultural employees.House345–50 (345 yea, 50 nay)Senate71–19 (71 yea, 19 nay)
- Jan 2, 1974Regional Rail Reorganization Act of 1973Transport, housing & emergenciesHouse284–59 (284 yea, 59 nay)Senate45–16 (45 yea, 16 nay)
- Dec 31, 1973An Act to provide a 7-percent increase in social security benefits beginning with March 1974 and an additional 4-percent increase beginning with June 1974, to provide increases in supplemental security income benefits, and for other purposes.Health, education & cultureProvides for an 11-percent cost-of-living increase in title II (Old-Age, Survivors, and Disability Insurance) of the Social Security Act.House301–13 (301 yea, 13 nay)Senate66–0 (66 yea, 0 nay)
- Dec 29, 1973Health Maintenance Organization Act of 1973Health, education & cultureDefines the term 'health maintenance organization' as a legal entity which provides basic and supplemental health services to its members and is organized and operated in a specified manner.HouseMethod not statedSenate83–1 (83 yea, 1 nay)
- Dec 28, 1973Comprehensive Employment and Training Act of 1973Economy, taxes & tradeAuthorizes necessary appropriations to carry out this Act for fiscal years 1974-1977, of which amounts $250,000,000 in fiscal 1974 and $350,000 in fiscal 1975 shall be for carrying out public employment programs under Title II.House330–33 (330 yea, 33 nay)SenateMethod not stated
- Dec 24, 1973District of Columbia Self-Government and Governmental Reorganization ActGovernment, justice & rightsHouse272–74 (272 yea, 74 nay)Senate77–13 (77 yea, 13 nay)
- Dec 17, 1973Foreign Assistance Act of 1973Defense & foreign affairsAdds to the Foreign Assistance Act of 1961 a statement of policy regarding development assistance authorizations.House210–193 (210 yea, 193 nay)Senate44–41 (44 yea, 41 nay)
- Nov 27, 1973Emergency Petroleum Allocation Act of 1973Energy & environmentStates that the purpose of this Act is to grant to the President of the United States and direct him to exercise specific temporary authority to deal with shortages of crude oil, residual fuel oil, and refined petroleum products or dislocations in their national distribution system.House348–46 (348 yea, 46 nay)Senate83–3 (83 yea, 3 nay)
- Nov 16, 1973Trans-Alaska Pipeline Authorization ActLand, water & farmingAuthorizes the Secretary of the Interior or appropriate agency head to grant rights of way for pipeline purposes for the transportation of petroleum products.House361–14 (361 yea, 14 nay)Senate80–5 (80 yea, 5 nay)
- Aug 13, 1973An Act to authorize appropriations for the construction of certain highways in accordance with title 23 of the United States Code, and for other purposes.Transport, housing & emergenciesProvides authorizations for the Interstate Highway Program through fiscal year 1979 in the amounts of $2,600,000,000 for fiscal year 1974; $3,000,000,000 annually for fiscal years 1975-76; and $3,250,000,000 annually for fiscal years 1977-79.House382–34 (382 yea, 34 nay)Senate91–5 (91 yea, 5 nay)
- Aug 10, 1973Agriculture and Consumer Protection Act of 1973Land, water & farmingProvides that the total amount of payments which a person shall be entitled to receive under titles IV, V and VI of the Agricultural Act of 1970 for 1974-1977 crops shall not exceed $20,000.House252–151 (252 yea, 151 nay)SenateMethod not stated
Data notes
Laws counted as important enactments, the same list the Laws page uses for its “Major law” badge, which explains where it comes from. The list does not yet cover a Congress still in session. Each summary is the first sentence of the Congressional Research Service summary, where one stands alone; votes are each chamber’s final-passage tally, or how it passed without a recorded vote.
Economy
Misery index
The misery index (unemployment plus inflation) was 8.1 in January 1969 and 16.4 in August 1974, with a high of 17 in July 1974.
Misery index
Unemployment and inflation
Data notes
The misery index adds the unemployment rate to inflation (consumer prices, change from a year earlier) for the same month. Unemployment is the BLS rate, seasonally adjusted, from 1948; inflation is from the consumer price index, from 1948. The first reading is the month the president took office, the last the month the term ended. Both are national averages and are revised.
View as table
| Period | Value |
|---|---|
| Jan 1969 | 8.1 |
| Feb 1969 | 8.1 |
| Mar 1969 | 8.6 |
| Apr 1969 | 8.9 |
| May 1969 | 8.9 |
| Jun 1969 | 9 |
| Jul 1969 | 8.9 |
| Aug 1969 | 8.9 |
| Sep 1969 | 9.4 |
| Oct 1969 | 9.4 |
| Nov 1969 | 9.4 |
| Dec 1969 | 9.4 |
| Jan 1970 | 10.1 |
| Feb 1970 | 10.6 |
| Mar 1970 | 10.5 |
| Apr 1970 | 10.7 |
| May 1970 | 10.8 |
| Jun 1970 | 10.9 |
| Jul 1970 | 10.7 |
| Aug 1970 | 10.8 |
| Sep 1970 | 11.1 |
| Oct 1970 | 11.1 |
| Nov 1970 | 11.5 |
| Dec 1970 | 11.7 |
| Jan 1971 | 11.2 |
| Feb 1971 | 10.6 |
| Mar 1971 | 10.4 |
| Apr 1971 | 10.1 |
| May 1971 | 10.3 |
| Jun 1971 | 10.3 |
| Jul 1971 | 10.4 |
| Aug 1971 | 10.5 |
| Sep 1971 | 10.1 |
| Oct 1971 | 9.6 |
| Nov 1971 | 9.5 |
| Dec 1971 | 9.3 |
| Jan 1972 | 9.1 |
| Feb 1972 | 9.5 |
| Mar 1972 | 9.3 |
| Apr 1972 | 9.2 |
| May 1972 | 8.9 |
| Jun 1972 | 8.7 |
| Jul 1972 | 8.6 |
| Aug 1972 | 8.5 |
| Sep 1972 | 8.7 |
| Oct 1972 | 8.8 |
| Nov 1972 | 8.7 |
| Dec 1972 | 8.6 |
| Jan 1973 | 8.5 |
| Feb 1973 | 8.9 |
| Mar 1973 | 9.7 |
| Apr 1973 | 10.3 |
| May 1973 | 10.4 |
| Jun 1973 | 10.9 |
| Jul 1973 | 10.5 |
| Aug 1973 | 12.2 |
| Sep 1973 | 12.2 |
| Oct 1973 | 12.7 |
| Nov 1973 | 13.1 |
| Dec 1973 | 13.8 |
| Jan 1974 | 14.7 |
| Feb 1974 | 15.2 |
| Mar 1974 | 15.2 |
| Apr 1974 | 15.2 |
| May 1974 | 15.8 |
| Jun 1974 | 16.3 |
| Jul 1974 | 17 |
| Aug 1974 | 16.4 |
| Period | Unemployment rate | Inflation |
|---|---|---|
| Jan 1969 | 3.4% | 4.7% |
| Feb 1969 | 3.4% | 4.7% |
| Mar 1969 | 3.4% | 5.2% |
| Apr 1969 | 3.4% | 5.5% |
| May 1969 | 3.4% | 5.5% |
| Jun 1969 | 3.5% | 5.5% |
| Jul 1969 | 3.5% | 5.4% |
| Aug 1969 | 3.5% | 5.4% |
| Sep 1969 | 3.7% | 5.7% |
| Oct 1969 | 3.7% | 5.7% |
| Nov 1969 | 3.5% | 5.9% |
| Dec 1969 | 3.5% | 5.9% |
| Jan 1970 | 3.9% | 6.2% |
| Feb 1970 | 4.2% | 6.4% |
| Mar 1970 | 4.4% | 6.1% |
| Apr 1970 | 4.6% | 6.1% |
| May 1970 | 4.8% | 6% |
| Jun 1970 | 4.9% | 6% |
| Jul 1970 | 5% | 5.7% |
| Aug 1970 | 5.1% | 5.7% |
| Sep 1970 | 5.4% | 5.7% |
| Oct 1970 | 5.5% | 5.6% |
| Nov 1970 | 5.9% | 5.6% |
| Dec 1970 | 6.1% | 5.6% |
| Jan 1971 | 5.9% | 5.3% |
| Feb 1971 | 5.9% | 4.7% |
| Mar 1971 | 6% | 4.4% |
| Apr 1971 | 5.9% | 4.2% |
| May 1971 | 5.9% | 4.4% |
| Jun 1971 | 5.9% | 4.4% |
| Jul 1971 | 6% | 4.4% |
| Aug 1971 | 6.1% | 4.4% |
| Sep 1971 | 6% | 4.1% |
| Oct 1971 | 5.8% | 3.8% |
| Nov 1971 | 6% | 3.5% |
| Dec 1971 | 6% | 3.3% |
| Jan 1972 | 5.8% | 3.3% |
| Feb 1972 | 5.7% | 3.8% |
| Mar 1972 | 5.8% | 3.5% |
| Apr 1972 | 5.7% | 3.5% |
| May 1972 | 5.7% | 3.2% |
| Jun 1972 | 5.7% | 3% |
| Jul 1972 | 5.6% | 3% |
| Aug 1972 | 5.6% | 2.9% |
| Sep 1972 | 5.5% | 3.2% |
| Oct 1972 | 5.6% | 3.2% |
| Nov 1972 | 5.3% | 3.4% |
| Dec 1972 | 5.2% | 3.4% |
| Jan 1973 | 4.9% | 3.6% |
| Feb 1973 | 5% | 3.9% |
| Mar 1973 | 4.9% | 4.8% |
| Apr 1973 | 5% | 5.3% |
| May 1973 | 4.9% | 5.5% |
| Jun 1973 | 4.9% | 6% |
| Jul 1973 | 4.8% | 5.7% |
| Aug 1973 | 4.8% | 7.4% |
| Sep 1973 | 4.8% | 7.4% |
| Oct 1973 | 4.6% | 8.1% |
| Nov 1973 | 4.8% | 8.3% |
| Dec 1973 | 4.9% | 8.9% |
| Jan 1974 | 5.1% | 9.6% |
| Feb 1974 | 5.2% | 10% |
| Mar 1974 | 5.1% | 10.1% |
| Apr 1974 | 5.1% | 10.1% |
| May 1974 | 5.1% | 10.7% |
| Jun 1974 | 5.4% | 10.9% |
| Jul 1974 | 5.5% | 11.5% |
| Aug 1974 | 5.5% | 10.9% |
Federal deficit and debt
The federal budget balance, as a share of GDP, was −0.3% in FY1970 and −0.4% in FY1974, with a low of −2% in FY1971.
Budget balance, % of GDP
Public debt, % of GDP
Data notes
The budget balance is the federal surplus (above zero) or deficit (below) as a share of GDP, by fiscal year (July to June through 1976, October to September since); a year counts for the president in office for most of it, though its budget was usually passed the year before. Debt is total public debt as a share of GDP, quarterly from 1966, including debt the government holds in its own trust funds.
View as table
| Period | Value |
|---|---|
| FY1970 | −0.3% |
| FY1971 | −2% |
| FY1972 | −1.8% |
| FY1973 | −1% |
| FY1974 | −0.4% |
| Period | Value |
|---|---|
| Q1 1969 | 36.2% |
| Q2 1969 | 35% |
| Q3 1969 | 35% |
| Q4 1969 | 35.5% |
| Q1 1970 | 35.4% |
| Q2 1970 | 34.7% |
| Q3 1970 | 34.9% |
| Q4 1970 | 35.7% |
| Q1 1971 | 34.5% |
| Q2 1971 | 34.4% |
| Q3 1971 | 35% |
| Q4 1971 | 35.6% |
| Q1 1972 | 34.7% |
| Q2 1972 | 33.7% |
| Q3 1972 | 33.6% |
| Q4 1972 | 33.7% |
| Q1 1973 | 33.3% |
| Q2 1973 | 32.3% |
| Q3 1973 | 32.1% |
| Q4 1973 | 31.8% |
| Q1 1974 | 31.8% |
| Q2 1974 | 31% |
| Q3 1974 | 30.9% |
Security and energy
Troops abroad
Troops stationed abroad numbered 1.04M in September 1969 and 441k in September 1973. Vietnam hosted the most in 3 of those years.
Active-duty troops abroad
Data notes
Active-duty U.S. military personnel stationed outside the United States and its territories (afloat and unassigned included where the source reports them), one snapshot a year (September; June for 1953–56), from the Defense Manpower Data Center’s tables and, for years it did not publish, troopdata. The year in progress shows its latest quarter, hatched. From December 2017 DMDC counts permanent assignments only, so later figures leave out most deployed forces.
View as table
| Period | Value |
|---|---|
| Sep 1969 | 1,039,575 |
| Sep 1970 | 870,344 |
| Sep 1971 | 669,771 |
| Sep 1972 | 522,003 |
| Sep 1973 | 440,809 |
Source: the site’s Presidency, Congress and Supreme Court data, each named in its card’s Data notes; party control of Congress from the House and Senate historians; appointments from the Federal Judicial Center. Portrait: public domain, via Wikimedia Commons. Built October 19, 2026.