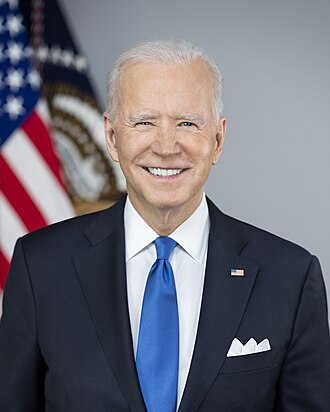
Joe Biden
46th president · Democrat · January 20, 2021 – January 19, 2025
Joseph Robinette Biden Jr. is an American retired politician who was the 46th president of the United States from 2021 to 2025. A member of the Democratic Party, he represented Delaware in the United States Senate from 1973 to 2009 and also served as the 47th vice president under President Barack Obama from 2009 to 2017. (Wikipedia, CC BY-SA 4.0)
How to read this
Each card takes a series from one of the site’s Presidency, Congress or Supreme Court pages and shows only the time Biden was in office. Monthly figures run from the month of the inauguration to the month the term ended; a fiscal or calendar year counts for the president who held office for most of its days. Cards whose data begins after 2021 say where it starts, and a card with no data for the term is left out.
These are conditions during a presidency, not a scorecard. Congress, the courts, the Federal Reserve, the business cycle and events abroad move every one of these numbers, and many policies take effect years after they are signed, so a change during a term is not a measure of what the president caused.
Who held power
Party control of Congress
Democrats held both chambers for 2 years, one chamber for 2 years and neither for 1 months.
- 119th Congress2025House: Rep.215 D · 220 RSenate: Rep.47 D · 53 R
- 118th Congress2023–2025House: Rep.213 D · 222 RSenate: Dem.51 D · 49 R
- 117th Congress2021–2023House: Dem.222 D · 212 RSenate*: Dem.50 D · 50 R
* The Senate majority changed hands during this Congress; the chip shows the party that held it longer while this president was in office.
Seats are at the start of each Congress. Democrats and Republicans include the independents who caucused with them.
Data notes
Supreme Court appointments
Joe Biden appointed one justice: Jackson (2022).
 Ketanji Jackson · Associate justiceNominated Feb 28, 2022 · confirmed 53–47
Data notes
A justice counts for the president who nominated them (a recess appointment from the day it began, if earlier). An associate justice later made chief by another president, like William Rehnquist, counts as an elevation for the second. Failed and withdrawn nominations are not listed. Dates and Senate votes from the Federal Judicial Center.
Laws and orders
Laws signed
Signed 636 laws, 18 of them major laws.
Laws signed per year in office
By policy area
- Commemorations196 (31%)
- Government, justice & rights119 (19%)
- Defense & foreign affairs81 (13%)
- Land, water & farming65 (10%)
- Health, education & culture62 (10%)
- Economy, taxes & trade58 (9%)
- Transport, housing & emergencies39 (6%)
- Energy & environment16 (3%)
Data notes
Public laws whose enactment date falls in the term, from Congress.gov (93rd Congress, 1973, on; private laws left out), counted through 2026-10-15. A law enacted over a veto is not counted as signed; a bill that became law without a signature is. A bar is one year in office, from the inauguration to the day before its anniversary. Policy areas are the Congressional Research Service’s, grouped as on the Laws page.
View as table
| Period | Value |
|---|---|
| 2021–22 | 81 |
| 2022–23 | 281 |
| 2023–24 | 35 |
| 2024–25 | 239 |
Executive orders
Signed 162 executive orders; the most common topic was economy, labor & technology (33).
Executive orders per year in office
By topic
- Economy, labor & technology33 (20%)
- Health & education28 (17%)
- Government operations25 (15%)
- Foreign policy24 (15%)
- National security & defense21 (13%)
- Immigration & justice13 (8%)
- Energy & environment9 (6%)
- Civil rights & civic life9 (6%)
Data notes
Executive orders signed in the term, from the Federal Register, whose electronic record begins in 1994. Each order has one primary topic, assigned as on the Executive orders page. Counts say how many orders were signed, not how much they did: one order can set up a program or rename an office. A bar is one year in office.
View as table
| Period | Value |
|---|---|
| 2021–22 | 77 |
| 2022–23 | 29 |
| 2023–24 | 24 |
| 2024–25 | 32 |
Major laws signed
18 of the laws Biden signed are counted as important enactments, newest first, with how each passed the House and Senate.
- Jan 5, 2025Social Security Fairness Act of 2023Health, education & cultureRepeals provisions that reduce Social Security benefits for individuals who receive other benefits, such as a pension from a state or local government.House327–75 (327 yea, 75 nay)Senate76–20 (76 yea, 20 nay)
- Dec 21, 2024American Relief Act, 2025Economy, taxes & tradeProvides continuing FY2025 appropriations for federal agencies and supplemental appropriations for disaster relief.House366–34 (366 yea, 34 nay)Senate85–11 (85 yea, 11 nay)
- May 16, 2024FAA Reauthorization Act of 2024Transport, housing & emergenciesReauthorizes through FY2028 and revises Federal Aviation Administration (FAA) and National Transportation Safety Board (NTSB) programs and activities.House387–26 (387 yea, 26 nay)Senate88–4 (88 yea, 4 nay)
- Apr 24, 2024Making emergency supplemental appropriations for the fiscal year ending September 30, 2024, and for other purposes.Economy, taxes & tradeProvides FY2024 supplemental appropriations to several federal agencies for assistance to Ukraine, Israel, and U.S. allies in the Indo-Pacific region.HouseUnanimous consentSenate79–18 (79 yea, 18 nay)
- Dec 29, 2022Consolidated Appropriations Act, 2023Economy, taxes & tradeHouse225–201 (225 yea, 201 nay)Senate68–29 (68 yea, 29 nay)
- Dec 13, 2022Respect for Marriage ActGovernment, justice & rightsProvides statutory authority for same-sex and interracial marriages.House258–169 (258 yea, 169 nay)Senate61–36 (61 yea, 36 nay)
- Sep 30, 2022Continuing Appropriations and Ukraine Supplemental Appropriations Act, 2023Economy, taxes & tradeProvides continuing FY2023 appropriations to federal agencies through December 16, 2022, provides supplemental appropriations for assistance to Ukraine, and establishes a compensation program for victims of the Hermit's Peak/Calf Canyon fire in New Mexico.House230–201 (230 yea, 201 nay)Senate72–25 (72 yea, 25 nay)
- Aug 16, 2022Inflation Reduction Act of 2022Economy, taxes & tradeHouse220–207 (220 yea, 207 nay)Senate51–50 (51 yea, 50 nay)
- Aug 10, 2022Sergeant First Class Heath Robinson Honoring our Promise to Address Comprehensive Toxics Act of 2022Defense & foreign affairsAddresses health care, presumption of service-connection, research, resources, and other matters related to veterans who were exposed to toxic substances during military service.House342–88 (342 yea, 88 nay)Senate86–11 (86 yea, 11 nay)
- Aug 9, 2022Chips and Science ActHealth, education & cultureProvides funds to support the domestic production of semiconductors and authorizes various programs and activities of the federal science agencies.House243–187 (243 yea, 187 nay)Senate64–33 (64 yea, 33 nay)
- Jun 25, 2022Bipartisan Safer Communities ActGovernment, justice & rightsMakes various changes to federal firearms laws, including to expand background check requirements, broaden the scope of existing restrictions, and establish new criminal offenses.House234–193 (234 yea, 193 nay)Senate65–33 (65 yea, 33 nay)
- May 21, 2022Additional Ukraine Supplemental Appropriations Act, 2022Defense & foreign affairsProvides $40.1 billion in FY2022 emergency supplemental appropriations for activities to respond to Russia's invasion of Ukraine.House368–57 (368 yea, 57 nay)Senate86–11 (86 yea, 11 nay)
- Apr 6, 2022Postal Service Reform Act of 2022Government, justice & rightsAddresses the finances and operations of the U.S. Postal Service (USPS).House342–92 (342 yea, 92 nay)Senate79–19 (79 yea, 19 nay)
- Mar 15, 2022Consolidated Appropriations Act, 2022Economy, taxes & tradeProvides appropriations to federal agencies for the remainder of FY2022, provides supplemental appropriations for activities to support Ukraine, and modifies or establishes various programs that address a wide range of policy areas.House260–171 (260 yea, 171 nay)Senate68–31 (68 yea, 31 nay)
- Dec 27, 2021National Defense Authorization Act for Fiscal Year 2022Defense & foreign affairsAuthorizes Department of Defense (DOD) activities and programs for FY2022 and addresses various other issues.House363–70 (363 yea, 70 nay)Senate88–11 (88 yea, 11 nay)
- Nov 15, 2021Infrastructure Investment and Jobs ActTransport, housing & emergenciesHouse228–206 (228 yea, 206 nay)Senate69–30 (69 yea, 30 nay)
- Jul 30, 2021Emergency Security Supplemental Appropriations Act, 2021Government, justice & rightsProvides FY2021 supplemental appropriations for federal agencies to respond to the events at the U.S. Capitol Complex on January 6, 2021, and assist Afghan refugees.House416–11 (416 yea, 11 nay)Senate98–0 (98 yea, 0 nay)
- Mar 11, 2021American Rescue Plan Act of 2021Economy, taxes & tradeProvides additional relief to address the continued impact of COVID-19 (i.e., coronavirus disease 2019) on the economy, public health, state and local governments, individuals, and businesses.House220–211 (220 yea, 211 nay)Senate50–49 (50 yea, 49 nay)
Data notes
Laws counted as important enactments, the same list the Laws page uses for its “Major law” badge, which explains where it comes from. The list does not yet cover a Congress still in session. Each summary is the first sentence of the Congressional Research Service summary, where one stands alone; votes are each chamber’s final-passage tally, or how it passed without a recorded vote.
Economy
Misery index
The misery index (unemployment plus inflation) was 7.8 in January 2021 and 7 in January 2025, with a high of 12.6 in June 2022.
Misery index
Unemployment and inflation
Data notes
The misery index adds the unemployment rate to inflation (consumer prices, change from a year earlier) for the same month. Unemployment is the BLS rate, seasonally adjusted, from 1948; inflation is from the consumer price index, from 1948. The first reading is the month the president took office, the last the month the term ended. Both are national averages and are revised.
View as table
| Period | Value |
|---|---|
| Jan 2021 | 7.8 |
| Feb 2021 | 7.9 |
| Mar 2021 | 8.8 |
| Apr 2021 | 10.2 |
| May 2021 | 10.7 |
| Jun 2021 | 11.2 |
| Jul 2021 | 10.6 |
| Aug 2021 | 10.3 |
| Sep 2021 | 10.1 |
| Oct 2021 | 10.7 |
| Nov 2021 | 11 |
| Dec 2021 | 11.1 |
| Jan 2022 | 11.6 |
| Feb 2022 | 11.8 |
| Mar 2022 | 12.3 |
| Apr 2022 | 11.9 |
| May 2022 | 12.1 |
| Jun 2022 | 12.6 |
| Jul 2022 | 12 |
| Aug 2022 | 11.8 |
| Sep 2022 | 11.7 |
| Oct 2022 | 11.4 |
| Nov 2022 | 10.7 |
| Dec 2022 | 9.9 |
| Jan 2023 | 9.8 |
| Feb 2023 | 9.6 |
| Mar 2023 | 8.4 |
| Apr 2023 | 8.4 |
| May 2023 | 7.7 |
| Jun 2023 | 6.7 |
| Jul 2023 | 6.8 |
| Aug 2023 | 7.4 |
| Sep 2023 | 7.4 |
| Oct 2023 | 7.2 |
| Nov 2023 | 6.8 |
| Dec 2023 | 7.1 |
| Jan 2024 | 6.8 |
| Feb 2024 | 7.1 |
| Mar 2024 | 7.4 |
| Apr 2024 | 7.3 |
| May 2024 | 7.1 |
| Jun 2024 | 7.1 |
| Jul 2024 | 7.1 |
| Aug 2024 | 6.8 |
| Sep 2024 | 6.5 |
| Oct 2024 | 6.7 |
| Nov 2024 | 6.9 |
| Dec 2024 | 7 |
| Jan 2025 | 7 |
| Period | Unemployment rate | Inflation |
|---|---|---|
| Jan 2021 | 6.4% | 1.4% |
| Feb 2021 | 6.2% | 1.7% |
| Mar 2021 | 6.1% | 2.7% |
| Apr 2021 | 6.1% | 4.1% |
| May 2021 | 5.8% | 4.9% |
| Jun 2021 | 5.9% | 5.3% |
| Jul 2021 | 5.4% | 5.2% |
| Aug 2021 | 5.1% | 5.2% |
| Sep 2021 | 4.7% | 5.4% |
| Oct 2021 | 4.5% | 6.2% |
| Nov 2021 | 4.1% | 6.9% |
| Dec 2021 | 3.9% | 7.2% |
| Jan 2022 | 4% | 7.6% |
| Feb 2022 | 3.9% | 7.9% |
| Mar 2022 | 3.7% | 8.6% |
| Apr 2022 | 3.7% | 8.2% |
| May 2022 | 3.6% | 8.5% |
| Jun 2022 | 3.6% | 9% |
| Jul 2022 | 3.5% | 8.5% |
| Aug 2022 | 3.6% | 8.2% |
| Sep 2022 | 3.5% | 8.2% |
| Oct 2022 | 3.6% | 7.8% |
| Nov 2022 | 3.6% | 7.1% |
| Dec 2022 | 3.5% | 6.4% |
| Jan 2023 | 3.5% | 6.3% |
| Feb 2023 | 3.6% | 6% |
| Mar 2023 | 3.5% | 4.9% |
| Apr 2023 | 3.4% | 5% |
| May 2023 | 3.6% | 4.1% |
| Jun 2023 | 3.6% | 3.1% |
| Jul 2023 | 3.5% | 3.3% |
| Aug 2023 | 3.7% | 3.7% |
| Sep 2023 | 3.7% | 3.7% |
| Oct 2023 | 3.9% | 3.3% |
| Nov 2023 | 3.7% | 3.1% |
| Dec 2023 | 3.8% | 3.3% |
| Jan 2024 | 3.7% | 3.1% |
| Feb 2024 | 3.9% | 3.2% |
| Mar 2024 | 3.9% | 3.5% |
| Apr 2024 | 3.9% | 3.4% |
| May 2024 | 3.9% | 3.2% |
| Jun 2024 | 4.1% | 3% |
| Jul 2024 | 4.2% | 2.9% |
| Aug 2024 | 4.2% | 2.6% |
| Sep 2024 | 4.1% | 2.4% |
| Oct 2024 | 4.1% | 2.6% |
| Nov 2024 | 4.2% | 2.7% |
| Dec 2024 | 4.1% | 2.9% |
| Jan 2025 | 4% | 3% |
Federal deficit and debt
The federal budget balance, as a share of GDP, was −11.7% in FY2021 and −6.2% in FY2024, with a high of −5.3% in FY2022.
Budget balance, % of GDP
Public debt, % of GDP
Data notes
The budget balance is the federal surplus (above zero) or deficit (below) as a share of GDP, by fiscal year (July to June through 1976, October to September since); a year counts for the president in office for most of it, though its budget was usually passed the year before. Debt is total public debt as a share of GDP, quarterly from 1966, including debt the government holds in its own trust funds.
View as table
| Period | Value |
|---|---|
| FY2021 | −11.7% |
| FY2022 | −5.3% |
| FY2023 | −6.1% |
| FY2024 | −6.2% |
| Period | Value |
|---|---|
| Q1 2021 | 124% |
| Q2 2021 | 121.8% |
| Q3 2021 | 118.5% |
| Q4 2021 | 119.4% |
| Q1 2022 | 120.4% |
| Q2 2022 | 118.2% |
| Q3 2022 | 117.4% |
| Q4 2022 | 117.4% |
| Q1 2023 | 115.6% |
| Q2 2023 | 117.4% |
| Q3 2023 | 118.1% |
| Q4 2023 | 119.6% |
| Q1 2024 | 120.5% |
| Q2 2024 | 119.5% |
| Q3 2024 | 120.2% |
| Q4 2024 | 121.4% |
| Q1 2025 | 120.5% |
Immigration
Green cards and refugees
New green cards numbered 740k in FY2021 and 1.36M in FY2024.
Green cards
Refugee admissions
Data notes
Green cards are people who became lawful permanent residents in the fiscal year, from the DHS Yearbook of Immigration Statistics (from FY1977). Refugee admissions are from the State Department’s Refugee Processing Center (from FY1980). A fiscal year counts for the administration in office for most of its days; a hatched bar is preliminary.
View as table
| Period | Value |
|---|---|
| FY2021 | 740,000 |
| FY2022 | 1,018,350 |
| FY2023 | 1,172,910 |
| FY2024 | 1,364,090 |
| Period | Value |
|---|---|
| FY2021 | 11,411 |
| FY2022 | 25,465 |
| FY2023 | 60,014 |
| FY2024 | 100,034 |
Removals and border encounters
Removals numbered 59k in FY2021 and 271k in FY2024.
Removals
Border encounters
Data notes
Removals are formal deportations: the Immigration and Naturalization Service’s through FY2002 (DHS Yearbook) and ICE’s own count from FY2003 (ICE); the two are not the same measure. Border encounters are Border Patrol apprehensions, plus port-of-entry inadmissibles from FY2004 and Title 42 expulsions in FY2020–23 (CBP); they count events, not people. A hatched bar is preliminary.
View as table
| Period | Value |
|---|---|
| FY2021 | 59,011 |
| FY2022 | 72,177 |
| FY2023 | 142,580 |
| FY2024 | 271,484 |
| Period | Value |
|---|---|
| FY2021 | 1,956,519 |
| FY2022 | 2,766,582 |
| FY2023 | 3,201,144 |
| FY2024 | 2,901,142 |
The U.S. and the world
Goods trade balance
The monthly goods trade balance was −$83.7B in January 2021 and −$151.7B in January 2025, with a high of −$79B in March 2023.
Goods balance, $B a month
Data notes
The goods trade balance is exports minus imports of goods, in billions of dollars a month, seasonally adjusted, on the Census basis, from 1991 (Census Bureau). Below zero the U.S. imported more goods than it exported. Services are not included. Dollars are not adjusted for inflation, so later years run larger.
View as table
| Period | Value |
|---|---|
| Jan 2021 | −$83.7B |
| Feb 2021 | −$85.7B |
| Mar 2021 | −$85.6B |
| Apr 2021 | −$84.6B |
| May 2021 | −$86.1B |
| Jun 2021 | −$90.6B |
| Jul 2021 | −$85.7B |
| Aug 2021 | −$89.9B |
| Sep 2021 | −$93.2B |
| Oct 2021 | −$85.1B |
| Nov 2021 | −$101.1B |
| Dec 2021 | −$99.4B |
| Jan 2022 | −$103.8B |
| Feb 2022 | −$102.1B |
| Mar 2022 | −$117.2B |
| Apr 2022 | −$102.3B |
| May 2022 | −$100.8B |
| Jun 2022 | −$98.3B |
| Jul 2022 | −$87.2B |
| Aug 2022 | −$89.6B |
| Sep 2022 | −$89.4B |
| Oct 2022 | −$98.8B |
| Nov 2022 | −$85.7B |
| Dec 2022 | −$92B |
| Jan 2023 | −$89.3B |
| Feb 2023 | −$89.6B |
| Mar 2023 | −$79B |
| Apr 2023 | −$94B |
| May 2023 | −$89B |
| Jun 2023 | −$88.3B |
| Jul 2023 | −$89.1B |
| Aug 2023 | −$84.7B |
| Sep 2023 | −$85.4B |
| Oct 2023 | −$89.5B |
| Nov 2023 | −$90.1B |
| Dec 2023 | −$86.5B |
| Jan 2024 | −$89.2B |
| Feb 2024 | −$88.5B |
| Mar 2024 | −$88.8B |
| Apr 2024 | −$96.7B |
| May 2024 | −$97B |
| Jun 2024 | −$97.9B |
| Jul 2024 | −$103.6B |
| Aug 2024 | −$96.8B |
| Sep 2024 | −$110B |
| Oct 2024 | −$102.1B |
| Nov 2024 | −$107.1B |
| Dec 2024 | −$123.3B |
| Jan 2025 | −$151.7B |
Foreign aid
Foreign aid disbursed came to $49.4B in FY2021 and $71.6B in FY2024, with a high of $80.5B in FY2023. Ukraine received the most in 3 of those years.
Disbursed, $ billions
Data notes
U.S. foreign assistance disbursed in each fiscal year, every country plus regional and global programs, in billions of dollars not adjusted for inflation, from ForeignAssistance.gov (from FY2001). The newest year is incomplete until agencies finish reporting and is hatched. The top recipient counts countries only.
View as table
| Period | Value |
|---|---|
| FY2021 | $49.4B |
| FY2022 | $74.3B |
| FY2023 | $80.5B |
| FY2024 | $71.6B |
Security and energy
Troops abroad
Troops stationed abroad numbered 168k in September 2021 and 160k in September 2024. Japan hosted the most in 4 of those years.
Active-duty troops abroad
Data notes
Active-duty U.S. military personnel stationed outside the United States and its territories (afloat and unassigned included where the source reports them), one snapshot a year (September; June for 1953–56), from the Defense Manpower Data Center’s tables and, for years it did not publish, troopdata. The year in progress shows its latest quarter, hatched. From December 2017 DMDC counts permanent assignments only, so later figures leave out most deployed forces.
View as table
| Period | Value |
|---|---|
| Sep 2021 | 168,051 |
| Sep 2022 | 164,868 |
| Sep 2023 | 161,523 |
| Sep 2024 | 159,645 |
Strategic Petroleum Reserve
The reserve held 638M bbl on Jan 22, 2021 and 395M bbl on Jan 24, 2025, with a low of 347M bbl on Jul 7, 2023.
Reserve level, million barrels
Data notes
Crude oil held in the Strategic Petroleum Reserve at the end of each week, in millions of barrels, from the Energy Information Administration (from August 1982). Sales, exchanges and refills are authorized by Congress and the executive branch at different times, and many take months to carry out. The Energy page marks each action.
View as table
| Period | Value |
|---|---|
| Jan 22, 2021 | 638M bbl |
| Jan 29, 2021 | 638M bbl |
| Feb 5, 2021 | 638M bbl |
| Feb 12, 2021 | 638M bbl |
| Feb 19, 2021 | 638M bbl |
| Feb 26, 2021 | 638M bbl |
| Mar 5, 2021 | 638M bbl |
| Mar 12, 2021 | 638M bbl |
| Mar 19, 2021 | 638M bbl |
| Mar 26, 2021 | 638M bbl |
| Apr 2, 2021 | 638M bbl |
| Apr 9, 2021 | 637M bbl |
| Apr 16, 2021 | 636M bbl |
| Apr 23, 2021 | 634M bbl |
| Apr 30, 2021 | 633M bbl |
| May 7, 2021 | 632M bbl |
| May 14, 2021 | 630M bbl |
| May 21, 2021 | 628M bbl |
| May 28, 2021 | 628M bbl |
| Jun 4, 2021 | 626M bbl |
| Jun 11, 2021 | 626M bbl |
| Jun 18, 2021 | 624M bbl |
| Jun 25, 2021 | 622M bbl |
| Jul 2, 2021 | 621M bbl |
| Jul 9, 2021 | 621M bbl |
| Jul 16, 2021 | 621M bbl |
| Jul 23, 2021 | 621M bbl |
| Jul 30, 2021 | 621M bbl |
| Aug 6, 2021 | 621M bbl |
| Aug 13, 2021 | 621M bbl |
| Aug 20, 2021 | 621M bbl |
| Aug 27, 2021 | 621M bbl |
| Sep 3, 2021 | 621M bbl |
| Sep 10, 2021 | 621M bbl |
| Sep 17, 2021 | 620M bbl |
| Sep 24, 2021 | 619M bbl |
| Oct 1, 2021 | 618M bbl |
| Oct 8, 2021 | 617M bbl |
| Oct 15, 2021 | 615M bbl |
| Oct 22, 2021 | 614M bbl |
| Oct 29, 2021 | 613M bbl |
| Nov 5, 2021 | 609M bbl |
| Nov 12, 2021 | 606M bbl |
| Nov 19, 2021 | 605M bbl |
| Nov 26, 2021 | 603M bbl |
| Dec 3, 2021 | 601M bbl |
| Dec 10, 2021 | 599M bbl |
| Dec 17, 2021 | 596M bbl |
| Dec 24, 2021 | 595M bbl |
| Dec 31, 2021 | 594M bbl |
| Jan 7, 2022 | 593M bbl |
| Jan 14, 2022 | 592M bbl |
| Jan 21, 2022 | 591M bbl |
| Jan 28, 2022 | 589M bbl |
| Feb 4, 2022 | 588M bbl |
| Feb 11, 2022 | 585M bbl |
| Feb 18, 2022 | 582M bbl |
| Feb 25, 2022 | 580M bbl |
| Mar 4, 2022 | 577M bbl |
| Mar 11, 2022 | 576M bbl |
| Mar 18, 2022 | 571M bbl |
| Mar 25, 2022 | 568M bbl |
| Apr 1, 2022 | 565M bbl |
| Apr 8, 2022 | 561M bbl |
| Apr 15, 2022 | 556M bbl |
| Apr 22, 2022 | 553M bbl |
| Apr 29, 2022 | 550M bbl |
| May 6, 2022 | 543M bbl |
| May 13, 2022 | 538M bbl |
| May 20, 2022 | 532M bbl |
| May 27, 2022 | 527M bbl |
| Jun 3, 2022 | 519M bbl |
| Jun 10, 2022 | 512M bbl |
| Jun 17, 2022 | 505M bbl |
| Jun 24, 2022 | 498M bbl |
| Jul 1, 2022 | 492M bbl |
| Jul 8, 2022 | 485M bbl |
| Jul 15, 2022 | 480M bbl |
| Jul 22, 2022 | 475M bbl |
| Jul 29, 2022 | 470M bbl |
| Aug 5, 2022 | 465M bbl |
| Aug 12, 2022 | 461M bbl |
| Aug 19, 2022 | 453M bbl |
| Aug 26, 2022 | 450M bbl |
| Sep 2, 2022 | 442M bbl |
| Sep 9, 2022 | 434M bbl |
| Sep 16, 2022 | 427M bbl |
| Sep 23, 2022 | 423M bbl |
| Sep 30, 2022 | 416M bbl |
| Oct 7, 2022 | 409M bbl |
| Oct 14, 2022 | 405M bbl |
| Oct 21, 2022 | 402M bbl |
| Oct 28, 2022 | 400M bbl |
| Nov 4, 2022 | 396M bbl |
| Nov 11, 2022 | 392M bbl |
| Nov 18, 2022 | 391M bbl |
| Nov 25, 2022 | 389M bbl |
| Dec 2, 2022 | 387M bbl |
| Dec 9, 2022 | 382M bbl |
| Dec 16, 2022 | 379M bbl |
| Dec 23, 2022 | 375M bbl |
| Dec 30, 2022 | 372M bbl |
| Jan 6, 2023 | 372M bbl |
| Jan 13, 2023 | 372M bbl |
| Jan 20, 2023 | 372M bbl |
| Jan 27, 2023 | 372M bbl |
| Feb 3, 2023 | 372M bbl |
| Feb 10, 2023 | 372M bbl |
| Feb 17, 2023 | 372M bbl |
| Feb 24, 2023 | 372M bbl |
| Mar 3, 2023 | 372M bbl |
| Mar 10, 2023 | 372M bbl |
| Mar 17, 2023 | 372M bbl |
| Mar 24, 2023 | 372M bbl |
| Mar 31, 2023 | 371M bbl |
| Apr 7, 2023 | 370M bbl |
| Apr 14, 2023 | 368M bbl |
| Apr 21, 2023 | 367M bbl |
| Apr 28, 2023 | 365M bbl |
| May 5, 2023 | 362M bbl |
| May 12, 2023 | 360M bbl |
| May 19, 2023 | 358M bbl |
| May 26, 2023 | 355M bbl |
| Jun 2, 2023 | 354M bbl |
| Jun 9, 2023 | 352M bbl |
| Jun 16, 2023 | 350M bbl |
| Jun 23, 2023 | 349M bbl |
| Jun 30, 2023 | 347M bbl |
| Jul 7, 2023 | 347M bbl |
| Jul 14, 2023 | 347M bbl |
| Jul 21, 2023 | 347M bbl |
| Jul 28, 2023 | 347M bbl |
| Aug 4, 2023 | 348M bbl |
| Aug 11, 2023 | 348M bbl |
| Aug 18, 2023 | 349M bbl |
| Aug 25, 2023 | 350M bbl |
| Sep 1, 2023 | 350M bbl |
| Sep 8, 2023 | 351M bbl |
| Sep 15, 2023 | 351M bbl |
| Sep 22, 2023 | 351M bbl |
| Sep 29, 2023 | 351M bbl |
| Oct 6, 2023 | 351M bbl |
| Oct 13, 2023 | 351M bbl |
| Oct 20, 2023 | 351M bbl |
| Oct 27, 2023 | 351M bbl |
| Nov 3, 2023 | 351M bbl |
| Nov 10, 2023 | 351M bbl |
| Nov 17, 2023 | 351M bbl |
| Nov 24, 2023 | 352M bbl |
| Dec 1, 2023 | 352M bbl |
| Dec 8, 2023 | 352M bbl |
| Dec 15, 2023 | 353M bbl |
| Dec 22, 2023 | 353M bbl |
| Dec 29, 2023 | 354M bbl |
| Jan 5, 2024 | 355M bbl |
| Jan 12, 2024 | 356M bbl |
| Jan 19, 2024 | 357M bbl |
| Jan 26, 2024 | 357M bbl |
| Feb 2, 2024 | 358M bbl |
| Feb 9, 2024 | 359M bbl |
| Feb 16, 2024 | 360M bbl |
| Feb 23, 2024 | 360M bbl |
| Mar 1, 2024 | 361M bbl |
| Mar 8, 2024 | 362M bbl |
| Mar 15, 2024 | 362M bbl |
| Mar 22, 2024 | 363M bbl |
| Mar 29, 2024 | 364M bbl |
| Apr 5, 2024 | 364M bbl |
| Apr 12, 2024 | 365M bbl |
| Apr 19, 2024 | 366M bbl |
| Apr 26, 2024 | 366M bbl |
| May 3, 2024 | 367M bbl |
| May 10, 2024 | 368M bbl |
| May 17, 2024 | 369M bbl |
| May 24, 2024 | 369M bbl |
| May 31, 2024 | 370M bbl |
| Jun 7, 2024 | 371M bbl |
| Jun 14, 2024 | 371M bbl |
| Jun 21, 2024 | 372M bbl |
| Jun 28, 2024 | 373M bbl |
| Jul 5, 2024 | 373M bbl |
| Jul 12, 2024 | 374M bbl |
| Jul 19, 2024 | 374M bbl |
| Jul 26, 2024 | 375M bbl |
| Aug 2, 2024 | 376M bbl |
| Aug 9, 2024 | 377M bbl |
| Aug 16, 2024 | 377M bbl |
| Aug 23, 2024 | 378M bbl |
| Aug 30, 2024 | 380M bbl |
| Sep 6, 2024 | 380M bbl |
| Sep 13, 2024 | 381M bbl |
| Sep 20, 2024 | 382M bbl |
| Sep 27, 2024 | 383M bbl |
| Oct 4, 2024 | 383M bbl |
| Oct 11, 2024 | 384M bbl |
| Oct 18, 2024 | 385M bbl |
| Oct 25, 2024 | 386M bbl |
| Nov 1, 2024 | 387M bbl |
| Nov 8, 2024 | 388M bbl |
| Nov 15, 2024 | 389M bbl |
| Nov 22, 2024 | 390M bbl |
| Nov 29, 2024 | 392M bbl |
| Dec 6, 2024 | 393M bbl |
| Dec 13, 2024 | 393M bbl |
| Dec 20, 2024 | 393M bbl |
| Dec 27, 2024 | 394M bbl |
| Jan 3, 2025 | 394M bbl |
| Jan 10, 2025 | 394M bbl |
| Jan 17, 2025 | 395M bbl |
| Jan 24, 2025 | 395M bbl |
Source: the site’s Presidency, Congress and Supreme Court data, each named in its card’s Data notes; party control of Congress from the House and Senate historians; appointments from the Federal Judicial Center. Portrait: public domain, via Wikimedia Commons. Built October 19, 2026.