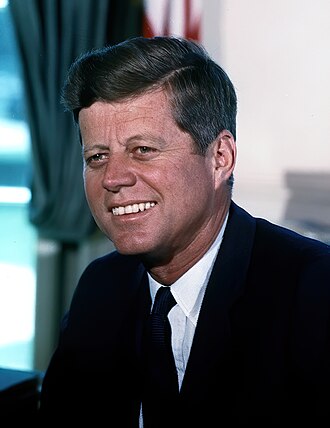
John F. Kennedy
35th president · Democrat · January 20, 1961 – November 21, 1963
John Fitzgerald Kennedy, also known as JFK, was the 35th president of the United States, serving from 1961 until his assassination in 1963. A member of the Democratic Party, he represented Massachusetts in both houses of the U.S. Congress before his presidency. (Wikipedia, CC BY-SA 4.0)
How to read this
Each card takes a series from one of the site’s Presidency, Congress or Supreme Court pages and shows only the time Kennedy was in office. Monthly figures run from the month of the inauguration to the month the term ended; a fiscal or calendar year counts for the president who held office for most of its days. Cards whose data begins after 1961 say where it starts, and a card with no data for the term is left out.
These are conditions during a presidency, not a scorecard. Congress, the courts, the Federal Reserve, the business cycle and events abroad move every one of these numbers, and many policies take effect years after they are signed, so a change during a term is not a measure of what the president caused.
Who held power
Party control of Congress
Democrats held both chambers of Congress throughout the time in office.
- 88th Congress1963House: Dem.258 D · 176 R · 1 otherSenate: Dem.66 D · 34 R
- 87th Congress1961–1963House: Dem.264 D · 173 RSenate: Dem.64 D · 36 R
Seats are at the start of each Congress. Democrats and Republicans include the independents who caucused with them.
Data notes
Supreme Court appointments
John F. Kennedy appointed 2 justices: White (1962) and Goldberg (1962).
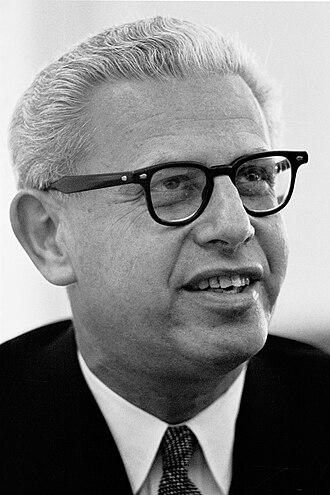 Arthur Goldberg · Associate justiceNominated Aug 31, 1962 · confirmed by voice vote
 Byron White · Associate justiceNominated Apr 3, 1962 · confirmed by voice vote
Data notes
A justice counts for the president who nominated them (a recess appointment from the day it began, if earlier). An associate justice later made chief by another president, like William Rehnquist, counts as an elevation for the second. Failed and withdrawn nominations are not listed. Dates and Senate votes from the Federal Judicial Center.
Economy
Misery index
The misery index (unemployment plus inflation) was 8.2 in January 1961 and 7 in November 1963, with a high of 8.4 in February 1961.
Misery index
Unemployment and inflation
Data notes
The misery index adds the unemployment rate to inflation (consumer prices, change from a year earlier) for the same month. Unemployment is the BLS rate, seasonally adjusted, from 1948; inflation is from the consumer price index, from 1948. The first reading is the month the president took office, the last the month the term ended. Both are national averages and are revised.
View as table
| Period | Value |
|---|---|
| Jan 1961 | 8.2 |
| Feb 1961 | 8.4 |
| Mar 1961 | 8.4 |
| Apr 1961 | 7.9 |
| May 1961 | 8 |
| Jun 1961 | 7.7 |
| Jul 1961 | 8.3 |
| Aug 1961 | 7.7 |
| Sep 1961 | 7.9 |
| Oct 1961 | 7.3 |
| Nov 1961 | 6.8 |
| Dec 1961 | 6.7 |
| Jan 1962 | 6.5 |
| Feb 1962 | 6.4 |
| Mar 1962 | 6.7 |
| Apr 1962 | 6.9 |
| May 1962 | 6.8 |
| Jun 1962 | 6.7 |
| Jul 1962 | 6.4 |
| Aug 1962 | 6.8 |
| Sep 1962 | 7.1 |
| Oct 1962 | 6.7 |
| Nov 1962 | 7 |
| Dec 1962 | 6.7 |
| Jan 1963 | 7 |
| Feb 1963 | 7.1 |
| Mar 1963 | 6.8 |
| Apr 1963 | 6.6 |
| May 1963 | 6.8 |
| Jun 1963 | 6.9 |
| Jul 1963 | 7.2 |
| Aug 1963 | 7 |
| Sep 1963 | 6.5 |
| Oct 1963 | 6.7 |
| Nov 1963 | 7 |
| Period | Unemployment rate | Inflation |
|---|---|---|
| Jan 1961 | 6.6% | 1.6% |
| Feb 1961 | 6.9% | 1.5% |
| Mar 1961 | 6.9% | 1.5% |
| Apr 1961 | 7% | 0.9% |
| May 1961 | 7.1% | 0.9% |
| Jun 1961 | 6.9% | 0.8% |
| Jul 1961 | 7% | 1.3% |
| Aug 1961 | 6.6% | 1.1% |
| Sep 1961 | 6.7% | 1.2% |
| Oct 1961 | 6.5% | 0.8% |
| Nov 1961 | 6.1% | 0.7% |
| Dec 1961 | 6% | 0.7% |
| Jan 1962 | 5.8% | 0.7% |
| Feb 1962 | 5.5% | 0.9% |
| Mar 1962 | 5.6% | 1.1% |
| Apr 1962 | 5.6% | 1.3% |
| May 1962 | 5.5% | 1.3% |
| Jun 1962 | 5.5% | 1.2% |
| Jul 1962 | 5.4% | 1% |
| Aug 1962 | 5.7% | 1.1% |
| Sep 1962 | 5.6% | 1.5% |
| Oct 1962 | 5.4% | 1.3% |
| Nov 1962 | 5.7% | 1.3% |
| Dec 1962 | 5.5% | 1.2% |
| Jan 1963 | 5.7% | 1.3% |
| Feb 1963 | 5.9% | 1.2% |
| Mar 1963 | 5.7% | 1.1% |
| Apr 1963 | 5.7% | 0.9% |
| May 1963 | 5.9% | 0.9% |
| Jun 1963 | 5.6% | 1.3% |
| Jul 1963 | 5.6% | 1.6% |
| Aug 1963 | 5.4% | 1.6% |
| Sep 1963 | 5.5% | 1% |
| Oct 1963 | 5.5% | 1.2% |
| Nov 1963 | 5.7% | 1.3% |
Federal deficit and debt
The federal budget balance, as a share of GDP, was −1.2% in FY1962 and −0.7% in FY1963.
Budget balance, % of GDP
Data notes
The budget balance is the federal surplus (above zero) or deficit (below) as a share of GDP, by fiscal year (July to June through 1976, October to September since); a year counts for the president in office for most of it, though its budget was usually passed the year before. Debt is total public debt as a share of GDP, quarterly from 1966, including debt the government holds in its own trust funds.
View as table
| Period | Value |
|---|---|
| FY1962 | −1.2% |
| FY1963 | −0.7% |
Security and energy
Troops abroad
Troops stationed abroad numbered 593k in September 1961 and 624k in September 1963, with a high of 662k in September 1962. Germany hosted the most in 3 of those years.
Active-duty troops abroad
Data notes
Active-duty U.S. military personnel stationed outside the United States and its territories (afloat and unassigned included where the source reports them), one snapshot a year (September; June for 1953–56), from the Defense Manpower Data Center’s tables and, for years it did not publish, troopdata. The year in progress shows its latest quarter, hatched. From December 2017 DMDC counts permanent assignments only, so later figures leave out most deployed forces.
View as table
| Period | Value |
|---|---|
| Sep 1961 | 592,872 |
| Sep 1962 | 661,929 |
| Sep 1963 | 623,761 |
Source: the site’s Presidency, Congress and Supreme Court data, each named in its card’s Data notes; party control of Congress from the House and Senate historians; appointments from the Federal Judicial Center. Portrait: public domain, via Wikimedia Commons. Built October 19, 2026.